A doubling in size, at a lower margin
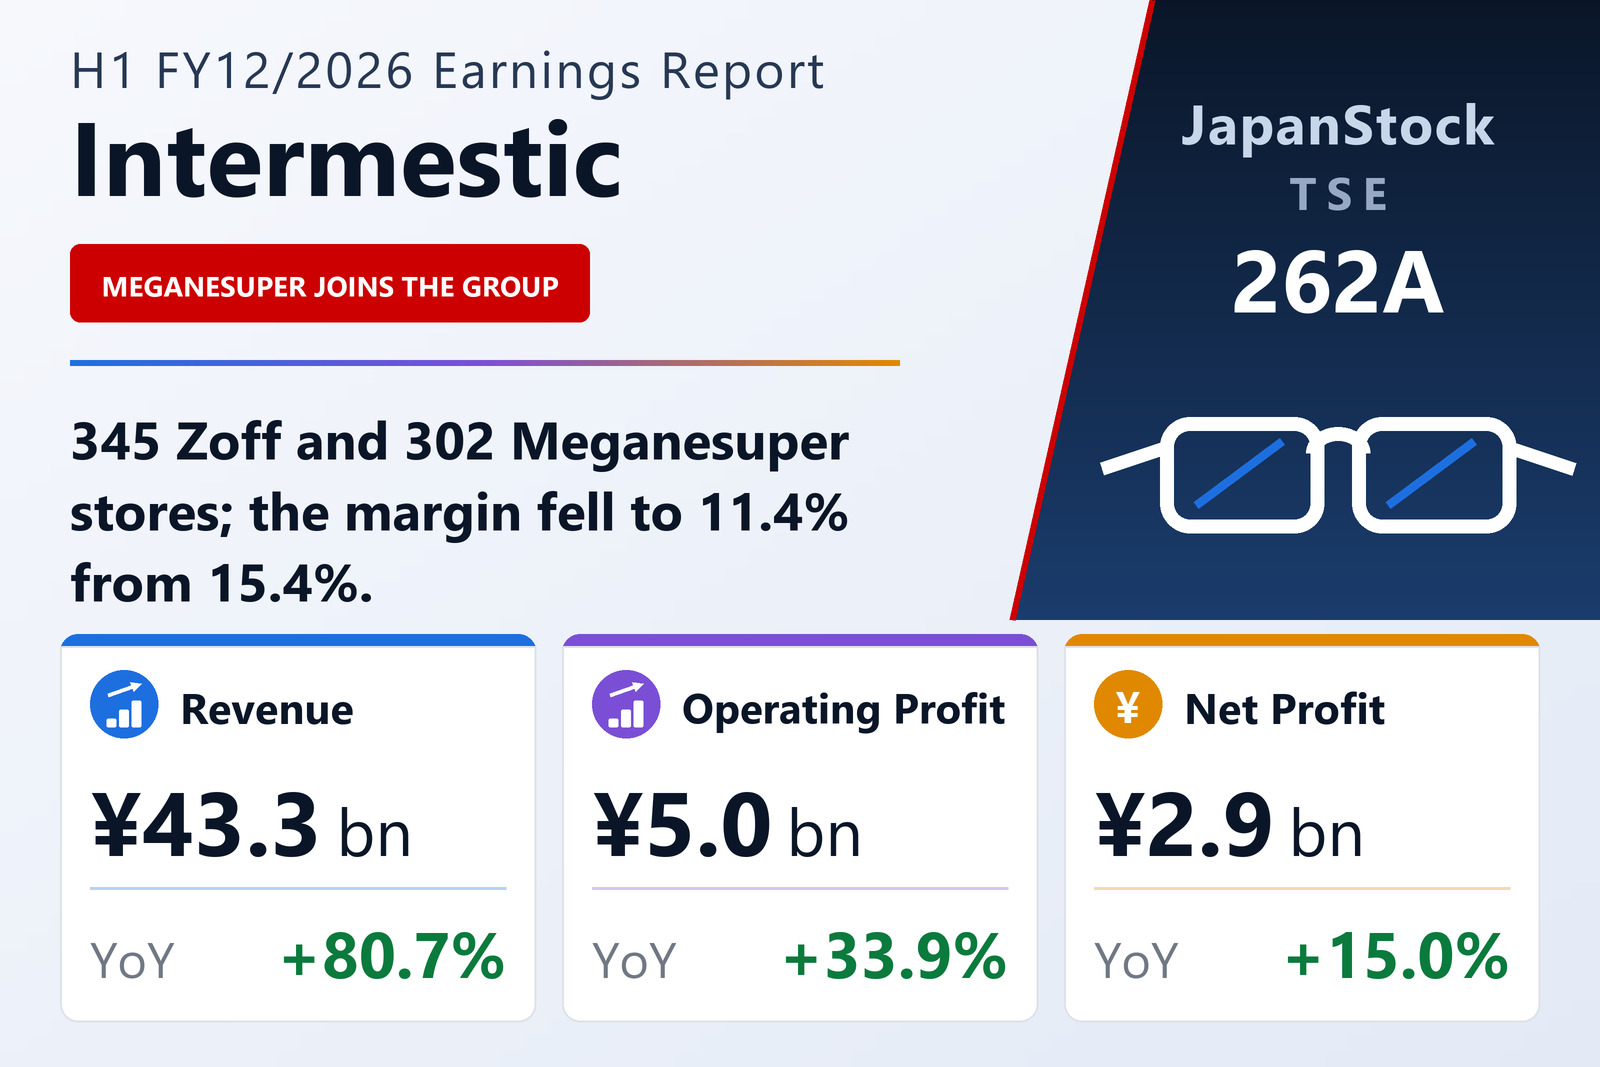
Intermestic Inc. (TSE: 262A) published consolidated results for the six months to June 30, 2026 on August 7, 2026 under Japanese GAAP. Net sales rose 80.7% to ¥43,305 million, operating profit 33.9% to ¥4,954 million, ordinary profit 27.3% to ¥4,709 million and net profit attributable to owners of the parent 15.0% to ¥2,906 million, for earnings per share of ¥94.94 against ¥82.61.
The four growth rates step down in order — 80.7%, 33.9%, 27.3%, 15.0% — which is the signature of a business that has grown by acquisition. The operating margin fell to 11.4% from 15.4%, and diluted earnings per share of ¥92.63 against ¥80.31 grew more slowly still. Prior-year figures have been restated to reflect the finalisation of provisional purchase accounting.
Two chains, 647 stores
The group ended the half operating 345 Zoff stores in Japan, all run by subsidiary Zoff Co., Ltd., and 302 Meganesuper stores, all run by subsidiary Meganesuper Co., Ltd. Overseas it had 20 stores — 17 franchises in Hong Kong and three directly operated in Singapore. ZOFF I SINGAPORE PTE. LTD. was newly consolidated during the half.
The segment split reflects how domestic the group is: Domestic revenue of ¥42,880 million (+82.3%) on segment profit of ¥4,929 million (+33.9%), against Overseas revenue of ¥424 million (−4.1%) on profit of ¥25 million. Overseas is under 1% of sales — the Hong Kong franchise model keeps the revenue off the group's books — so for now the group's results are a Japanese story.
The company's own framing
Intermestic states its vision as "Eye Performance": going beyond corrective eyewear to present glasses as a fashion item and, further, as a tool that extends human capability, aiming to be a brand society and daily life need.
It describes a domestic economy recovering moderately on better employment and incomes, but with continued price rises making consumers cautious and leaving some hesitation in personal consumption — the environment that matters most for a mid-priced eyewear chain.
Balance sheet and guidance
Total assets were near-flat from the December year-end at ¥65,788 million while net assets rose 6.6% to ¥27,680 million, lifting the equity ratio to 42.1% from 39.5%. Comprehensive income was ¥2,985 million (+18.7%).
Full-year FY12/2026 guidance is unchanged: net sales of ¥85,800 million (+71.1%), operating profit of ¥7,502 million (+25.2%), ordinary profit of ¥7,100 million (+18.7%) and net profit of ¥4,752 million (+15.4%), for earnings per share of ¥155.32 — calculated on the share count outstanding at December 31, 2025.
The half has already delivered 66.0% of the full-year operating-profit target and 61.2% of the net-profit target, which for a retailer with a seasonally weighted second half is worth noting. The annual dividend forecast rises to ¥51.00 per share from ¥44.00, paid entirely at the year-end.
| Metric | H1 FY12/2026 | H1 FY12/2025 | Change |
|---|---|---|---|
| Net sales (¥ million) | 43,305 | 23,970 | +80.7% |
| Operating profit (¥ million) | 4,954 | 3,699 | +33.9% |
| Operating margin | 11.4% | 15.4% | −4.0 pt |
| Ordinary profit (¥ million) | 4,709 | 3,700 | +27.3% |
| Net profit attrib. to owners of parent (¥ million) | 2,906 | 2,527 | +15.0% |
| Comprehensive income (¥ million) | 2,985 | 2,514 | +18.7% |
| EPS (¥) | 94.94 | 82.61 | +14.9% |
| Domestic — revenue (¥ million) | 42,880 | 23,527 | +82.3% |
| Domestic — segment profit (¥ million) | 4,929 | 3,681 | +33.9% |
| Overseas — revenue (¥ million) | 424 | 442 | −4.1% |
| Overseas — segment profit (¥ million) | 25 | 17 | +47.1% |
| Total assets (¥ million) | 65,788 | 65,668 | +0.2% |
| Net assets (¥ million) | 27,680 | 25,966 | +6.6% |
| Equity ratio | 42.1% | 39.5% | +2.6 pt |
| FY12/2026 guidance — revenue (¥ million) | 85,800 | — | +71.1% |
| FY12/2026 guidance — operating profit (¥ million) | 7,502 | — | +25.2% |
| FY12/2026 guidance — ordinary profit (¥ million) | 7,100 | — | +18.7% |
| FY12/2026 guidance — net profit (¥ million) | 4,752 | — | +15.4% |
| FY12/2026 guidance — EPS (¥) | 155.32 | — | n.m. |
| Annual dividend per share (¥) | 51.00 | 44.00 | +15.9% |
JapanStockPulse provides informational content only and does not constitute investment advice. Figures are taken from the company's published earnings short report and may be subject to subsequent revision.