A 43-quarter streak, and a profit line that reflects it
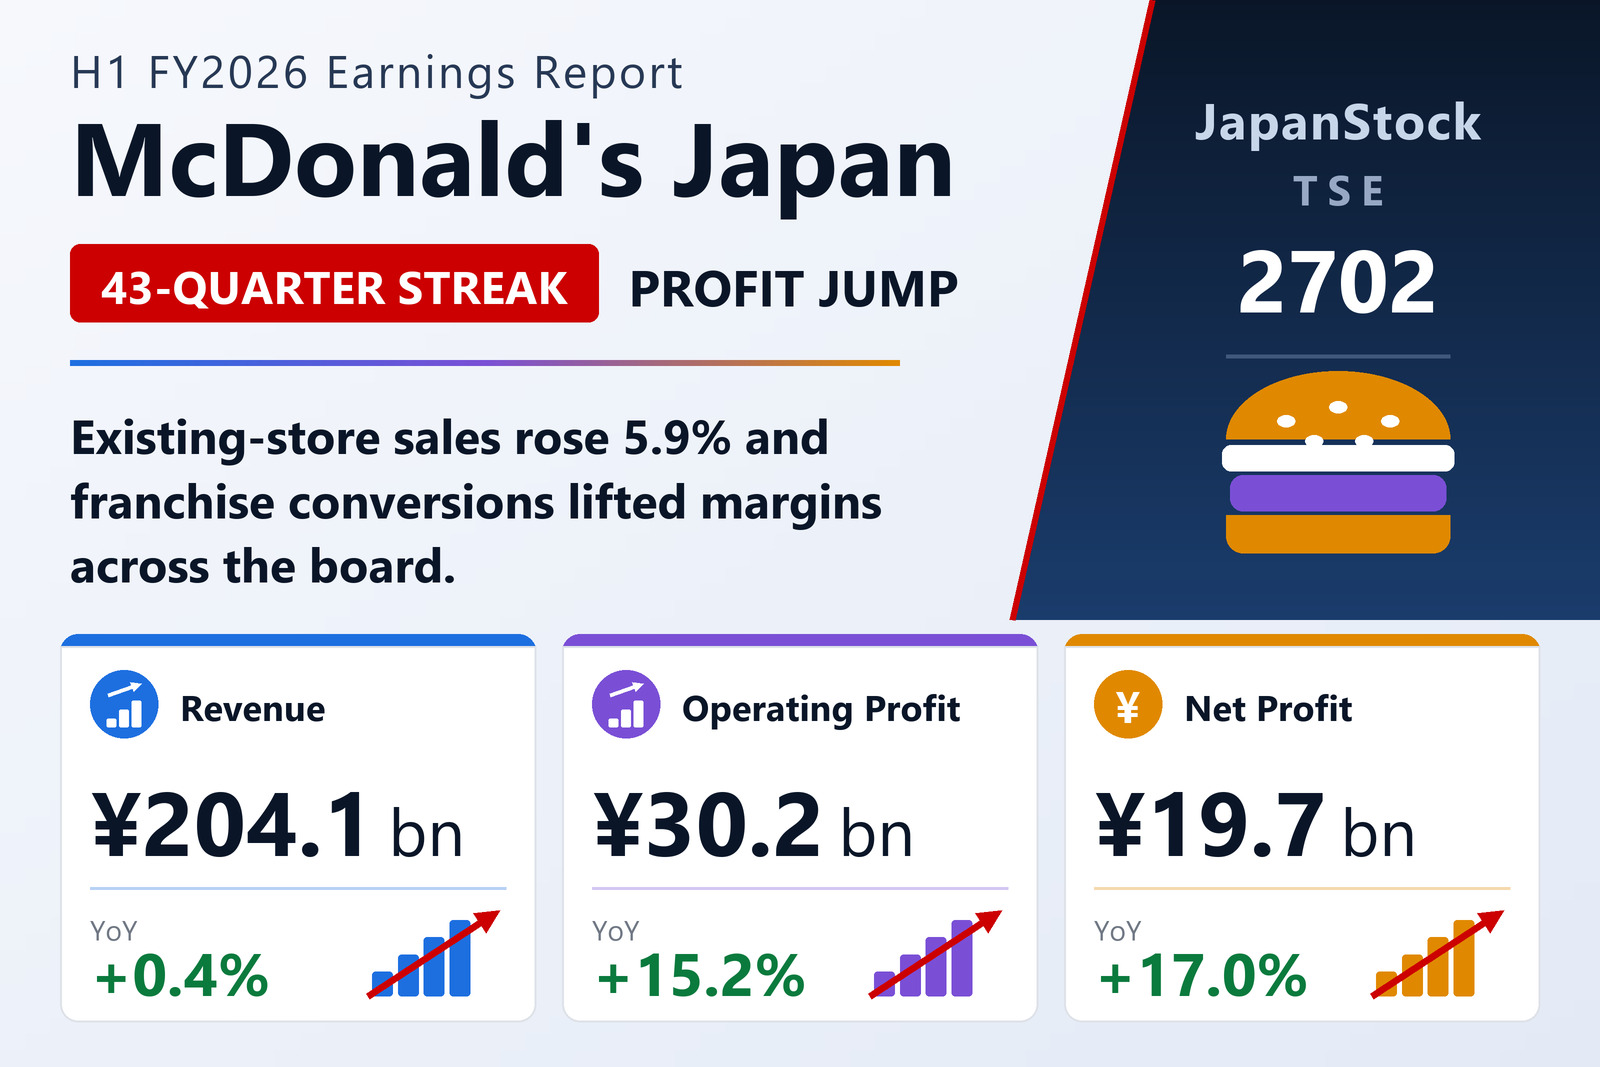
McDonald's Holdings Company (Japan), Ltd. (TSE: 2702) reported consolidated results for the first six months of the year to December 2026 — January 1 to June 30 — under Japanese GAAP. Net sales edged up 0.4% to ¥204,058 million, but operating profit climbed 15.2% to ¥30,200 million, an increase of ¥3,978 million. Ordinary profit rose 17.8% to ¥30,816 million, up ¥4,663 million, and net profit attributable to owners of the parent gained 17.0% to ¥19,657 million, up ¥2,861 million. Basic earnings per share came in at ¥147.84 against ¥126.33 a year earlier, with no diluted figure reported, and comprehensive income rose 17.0% to ¥19,643 million. The operating margin widened to 14.8% from 12.9%.
Behind the near-static revenue line sits a business that grew briskly. Existing-store sales rose 5.9% — the 43rd consecutive quarter of growth, an unbroken run reaching from the fourth quarter of FY2015 through the second quarter of FY2026. Systemwide sales, which combine the turnover of company-operated and franchised restaurants, reached ¥464,322 million, up ¥34,535 million year on year. The results were disclosed on August 7, 2026, with the semi-annual report due on August 10. The company, led by President and Chief Executive Officer Thomas Koh, does not report by segment: its business is the single hamburger-restaurant segment.
Why reported revenue barely moved
Systemwide sales are not the reported top line, and the gap between the two is the whole story of this half. Net sales rose only ¥744 million because the revenue mix shifted toward franchising: sales at company-operated stores fell to ¥123,824 million, a decline of ¥9,523 million, while franchise revenue rose to ¥80,233 million, an increase of ¥10,267 million.
The arithmetic is structural rather than commercial. When a company-operated restaurant is handed to a franchisee, its entire gross turnover leaves the consolidated revenue line and is replaced by rent and royalty income — a much smaller number, but a far higher-margin one. Forty-three company-operated stores were converted during the six months, which is why customers spending 5.9% more at the same restaurants produced almost no movement in reported sales while profit advanced by double digits.
Every cost ratio moved the right way
Cost discipline reinforced the mix effect. The company-operated store cost ratio improved to 87.6% from 88.2%, with food costs at 38.1% of sales, labour costs at 24.8%, down from 26.0%, and other costs at 24.7%. The franchise revenue cost ratio eased to 61.4% from 61.7%. Taken together, the total cost of sales ratio fell to 77.3% from 79.1%, with the absolute cost of sales down ¥3,094 million.
Selling, general and administrative expenses came to ¥16,145 million, ¥139 million lower than a year earlier and equal to 7.9% of net sales against 8.0%. Within that total, advertising and promotion spending rose to ¥12,771 million, or 6.3% of sales, up from 6.1% — the company spent more on marketing, not less. The saving came from general and administrative costs, which fell to ¥3,373 million, or 1.7% of sales, from 1.9%.
3,038 restaurants, a three-year plan and a World Cup
The network finished the half at 3,038 restaurants, up from 3,025 at the end of December 2025. The composition changed more than the total: company-operated outlets fell to 664 from 705 while franchised outlets rose to 2,374 from 2,320. During the six months the company opened 35 restaurants, closed 22, remodelled 189 and converted 43 company-operated stores to franchise.
That shift is the explicit strategy of the medium-term management plan for 2025 to 2027, published in February 2025, whose stated ambition is to remain "the most loved restaurant brand in Japan" by strengthening and expanding a locally rooted franchise business. The plan sets three focus areas — Menu & Value, Store Portfolio & Digital, and Sustainability & People — and four financial targets: systemwide sales growth of 4–6% a year, operating profit growth of 4–6% a year, an operating margin of 13% and a return on equity of 11% or more. Over the three years from 2025 the company is targeting a net increase of more than 100 restaurants and more than 1,000 remodels.
The first half delivered the plan's commercial programme. A price revision in February 2026 was paired with product renewals, and the "Tokuninarudo" value campaign ran alongside seasonal limited-time menus and collaboration items. From June the company served as an official sponsor and official restaurant of the FIFA World Cup, under a concept of sharing fans' passion. Digital membership, including "My McDonald's Rewards", was expanded further. On the workforce side, the company was selected as a "Nadeshiko Brand" by the Ministry of Economy, Trade and Industry and the Tokyo Stock Exchange for promoting women's advancement, and in April it launched "Comeback! Crew", a spot-work platform open only to former McDonald's crew members — a sizeable pool, given roughly 220,000 current crew and some 3 million alumni in Japan.
Cash, revised guidance and a ¥64 dividend
Total assets stood at ¥361,616 million at June 30, 2026, down from ¥364,473 million at the end of December 2025, while net assets rose to ¥292,664 million from ¥280,467 million. The equity ratio strengthened sharply to 80.9% from 77.0% — the result of liabilities shrinking faster than assets. Current assets fell ¥3,254 million to ¥105,656 million, mainly a ¥4,787 million decline in cash and deposits, while non-current assets edged up ¥398 million to ¥255,960 million as property, plant and equipment gained ¥2,308 million and investments and other assets fell ¥1,765 million. Current liabilities dropped ¥14,817 million to ¥62,524 million, driven by an ¥8,167 million fall in other liabilities and a ¥2,282 million reduction in accounts payable; non-current liabilities eased ¥235 million to ¥6,427 million.
Cash and equivalents ended the half at ¥66,634 million, ¥4,787 million lower. Operating cash flow was a positive ¥24,485 million, ¥5,465 million less than a year earlier, on pre-tax profit of ¥30,104 million. Investing activities consumed ¥21,744 million, principally ¥22,354 million of purchases of property, plant and equipment — the remodelling programme in cash form. Financing used ¥7,527 million, an outflow ¥925 million larger than a year earlier, mainly ¥7,445 million of dividends paid.
Alongside the results, on August 7 the company revised the full-year forecast it had published on February 6, 2026, issuing a separate notice of the revision. For FY12/2026 it now guides to net sales of ¥408,000 million, a fall of 2.1%, operating profit of ¥55,500 million, up 4.2%, ordinary profit of ¥55,500 million, up 6.6%, and net profit attributable to owners of ¥35,000 million, up 3.2%, for EPS of ¥263.24. The combination of guided revenue decline and guided profit growth has the same cause as the flat first half: converting company-operated restaurants to franchises removes their gross store sales from the reported top line while adding higher-margin royalty income. The first half already accounts for 54.4% of the full-year operating profit target.
The dividend is going up regardless of the shrinking revenue line. Against FY12/2025's actual payout of ¥56.00, paid entirely at the year-end with no interim, the company forecasts ¥64.00 for FY12/2026 — again a single year-end payment, unchanged from its previous forecast, and an increase of 14.3%.
| Metric | H1 FY12/2026 | H1 FY12/2025 | YoY |
|---|---|---|---|
| Net sales (¥ million) | 204,058 | 203,314 | +0.4% |
| Systemwide sales (¥ million) | 464,322 | 429,787 | +8.0% |
| Existing-store sales growth | +5.9% | — | 43rd straight quarter |
| Operating profit (¥ million) | 30,200 | 26,222 | +15.2% |
| Ordinary profit (¥ million) | 30,816 | 26,153 | +17.8% |
| Net profit attrib. to owners (¥ million) | 19,657 | 16,796 | +17.0% |
| Basic EPS (¥) | 147.84 | 126.33 | +17.0% |
| Comprehensive income (¥ million) | 19,643 | 16,783 | +17.0% |
| Operating margin | 14.8% | 12.9% | +1.9 pt |
| Company-operated store sales (¥ million) | 123,824 | 133,347 | −7.1% |
| Franchise revenue (¥ million) | 80,233 | 69,966 | +14.7% |
| Total cost of sales ratio | 77.3% | 79.1% | −1.8 pt |
| Equity ratio (period-end vs Dec 31, 2025) | 80.9% | 77.0% | +3.9 pt |
| Total restaurants (period-end vs Dec 31, 2025) | 3,038 | 3,025 | +13 |
| FY12/2026 net sales guidance (¥ million) | 408,000 | — | −2.1% |
| FY12/2026 operating profit guidance (¥ million) | 55,500 | — | +4.2% |
| FY12/2026 ordinary profit guidance (¥ million) | 55,500 | — | +6.6% |
| FY12/2026 net profit guidance (¥ million) | 35,000 | — | +3.2% |
| Annual dividend per share (¥; FY26 forecast vs FY25 actual) | 64.00 | 56.00 | +14.3% |
JapanStockPulse provides informational content only and does not constitute investment advice. Figures are taken from the company's published earnings short report and may be subject to subsequent revision.