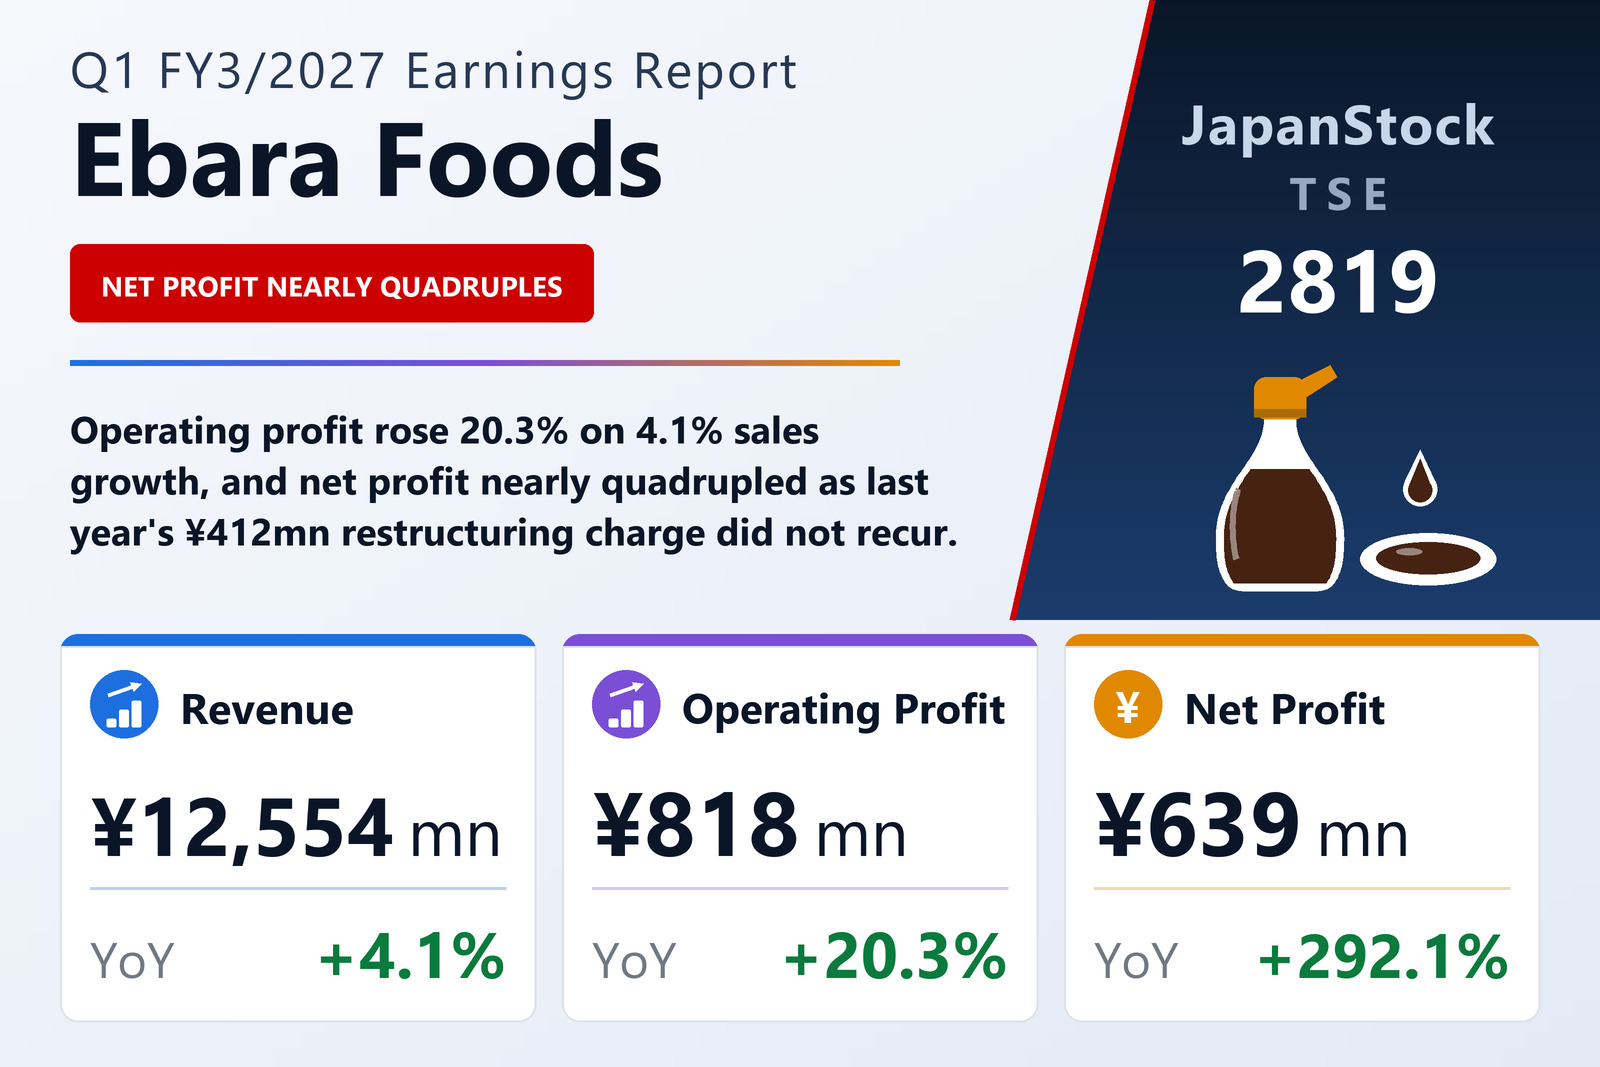
Sales up 4.1%, operating profit up 20.3%
Ebara Foods Industry, Inc. (TSE: 2819), the Japanese maker of sauces and seasonings for household and commercial use, published consolidated results for the first quarter of the fiscal year ending March 2027 — the three months from April 1 to June 30, 2026 — on August 7, 2026 under Japanese GAAP. Revenue rose 4.1% to ¥12,554 million, operating profit 20.3% to ¥818 million, ordinary profit 36.2% to ¥946 million and profit attributable to owners of the parent 292.1% to ¥639 million, for earnings per share of ¥65.67 against ¥16.69. The filing names the Tokyo Stock Exchange as the listing venue.
The operating result came from a modest widening of two spreads. Cost of sales rose 3.1% to ¥8,066 million, a little slower than revenue, so gross profit grew 5.9% to ¥4,487 million and the gross margin edged up from 35.1% to 35.7%. Selling, general and administrative expenses rose 3.2% to ¥3,669 million, also slower than revenue. Of the ¥251 million added at the gross-profit line, SG&A absorbed ¥113 million and ¥138 million reached operating profit, lifting the operating margin from 5.6% to 6.5%. The filing itself attributes the profit increase simply to higher sales.
Below the operating line, a subsidy, no currency loss and no restructuring charge
Ordinary profit rose faster than operating profit, 36.2% against 20.3%, because non-operating income roughly doubled to ¥136 million from ¥64 million — including ¥60 million of subsidy income that did not appear a year earlier — while non-operating expenses fell to ¥7 million from ¥49 million, the prior-year figure having included a ¥42 million foreign-exchange loss.
The larger swing came one line lower. A year ago the company booked ¥412 million of structural-reform expenses as an extraordinary loss, which cut pre-tax profit to ¥282 million; this quarter the extraordinary items were a ¥9 million gain on the sale of investment securities and a ¥1 million loss on the disposal of fixed assets. Pre-tax profit therefore rose to ¥955 million, income taxes were ¥315 million against ¥119 million, and profit attributable to owners of the parent reached ¥639 million against ¥163 million. The filing itself cites the prior-year extraordinary loss as a factor, so most of the near-quadrupling reflects the absence of a one-off charge rather than an equivalent improvement in trading. Comprehensive income was ¥738 million, up 127.5%.
Food carries the growth, and commercial products outpaced household
The Food segment, about 85% of revenue, grew 4.7% to ¥10,636 million, and its segment profit rose to ¥894 million from ¥800 million. Within it, household products rose 3.1% to ¥7,544 million and commercial products 9.0% to ¥3,092 million. The commercial increase came from its 'other' product group, which rose 24.4% to ¥1,330 million on contributions from overseas business and domestic group companies — more than the whole commercial gain, since commercial meat seasonings slipped 1.4% to ¥837 million and soups rose only 0.6% to ¥924 million.
On the household side, meat seasonings — the largest product group — rose 2.0% to ¥3,583 million, helped by an expanded Ogon no Aji line-up and a new product, Yakiniku Tanno. Hot-pot seasonings rose 4.7% to ¥1,288 million on Sukiyaki no Tare and the Puchitto Nabe single-portion seasonings, and the household 'other' group rose 7.9% to ¥1,732 million on the Puchitto Udon and Puchitto Chuka portion products, with the company's curry flakes described as steady. Vegetable seasonings were the one household group to shrink, falling 3.1% to ¥939 million; the filing gives no reason for that decline. The company describes a difficult backdrop in which consumers stayed cost-conscious as food prices rose and raw-material procurement costs increased.
Logistics profit improves on flat sales
The Logistics segment's revenue was almost unchanged, up 0.3% to ¥1,757 million, but its segment profit rose to ¥42 million from ¥24 million; the filing does not explain the improvement. The Other category, which groups advertising and staffing businesses, grew revenue 7.4% to ¥159 million and earned ¥19 million against a figure that rounds to zero a year earlier. Corporate costs not allocated to segments fell to ¥137 million from ¥144 million.
Cash moved into time deposits, and liabilities fell 10%
Total assets fell 1.9% to ¥49,827 million from ¥50,793 million at March 31, 2026, while liabilities fell 10.0% to ¥13,269 million, mainly because accounts payable–other dropped to ¥1,145 million from ¥2,537 million; income taxes payable also fell, to ¥361 million from ¥852 million, while the bonus provision rose to ¥877 million from ¥509 million. Net assets rose 1.4% to ¥36,557 million, lifting the equity ratio from 71.0% to 73.4% and net assets per share to ¥3,753.72 from ¥3,702.24.
Cash and cash equivalents fell by ¥2,851 million to ¥13,297 million, but most of that money stayed on the balance sheet: investing activities used ¥2,716 million, of which ¥2,006 million was placed in time deposits and ¥633 million went on property, plant and equipment. Cash and deposits, the balance-sheet line that includes those deposits, fell only ¥837 million, to ¥16,297 million. Operating activities generated just ¥6 million against ¥521 million a year earlier, as ¥955 million of pre-tax profit, ¥397 million of depreciation and a ¥375 million rise in the bonus provision were offset by a ¥795 million fall in accounts payable–other and ¥767 million of income taxes paid. Financing activities used ¥169 million, chiefly ¥239 million of dividends, partly offset by a ¥92 million net increase in short-term borrowings.
Guidance unchanged, with the quarter already past half the operating-profit target
The full-year forecast published on May 15, 2026 was left unchanged. For FY3/2027 Ebara Foods expects revenue of ¥50,200 million (+0.4%), operating profit of ¥1,500 million (−37.6%), ordinary profit of ¥1,700 million (−36.5%) and profit attributable to owners of ¥1,000 million (−43.9%), for earnings per share of ¥102.68, a figure that takes account of treasury shares acquired up to June 30, 2026. The first quarter delivered 25.0% of guided revenue but 54.5% of guided operating profit and 63.9% of guided net profit, leaving an implied ¥682 million of operating profit for the remaining nine months against the ¥818 million booked in these three. This filing does not explain why the company expects full-year profit to fall so sharply, and one quarter's progress is not necessarily indicative of the full year.
The dividend forecast was also unchanged: ¥25.00 at the interim and ¥25.00 at the year-end, for an annual ¥50.00 against ¥47.00 for FY3/2026, up 6.4% — about 49% of the guided ¥102.68 of earnings per share. The company is in the final year of its three-year medium-term management plan, Ebara Reboot 2026, which it describes as a phase of investment and structural reform.
| Metric | Q1 FY3/2027 | Q1 FY3/2026 | Change |
|---|---|---|---|
| Revenue (¥ million) | 12,554 | 12,057 | +4.1% |
| Gross profit (¥ million) | 4,487 | 4,236 | +5.9% |
| Gross margin | 35.7% | 35.1% | +0.6 pt |
| SG&A expenses (¥ million) | 3,669 | 3,556 | +3.2% |
| Operating profit (¥ million) | 818 | 680 | +20.3% |
| Operating margin | 6.5% | 5.6% | +0.9 pt |
| Ordinary profit (¥ million) | 946 | 695 | +36.2% |
| Pre-tax profit (¥ million) | 955 | 282 | +238.7% |
| Net profit attrib. to owners of parent (¥ million) | 639 | 163 | +292.1% |
| Comprehensive income (¥ million) | 738 | 324 | +127.5% |
| EPS (¥) | 65.67 | 16.69 | +293.5% |
| Food — revenue (¥ million) | 10,636 | 10,156 | +4.7% |
| Food — segment profit (¥ million) | 894 | 800 | +11.8% |
| Food — household products revenue (¥ million) | 7,544 | 7,318 | +3.1% |
| Food — commercial products revenue (¥ million) | 3,092 | 2,838 | +9.0% |
| Logistics — revenue (¥ million) | 1,757 | 1,752 | +0.3% |
| Logistics — segment profit (¥ million) | 42 | 24 | +75.0% |
| Other — revenue (¥ million) | 159 | 148 | +7.4% |
| Other — segment profit (¥ million) | 19 | 0 | n.m. |
| Operating cash flow (¥ million) | 6 | 521 | −98.8% |
| Total assets (¥ million) | 49,827 | 50,793 | −1.9% |
| Net assets (¥ million) | 36,557 | 36,056 | +1.4% |
| Cash and deposits (¥ million) | 16,297 | 17,134 | −4.9% |
| Equity ratio | 73.4% | 71.0% | +2.4 pt |
| FY3/2027 guidance — revenue (¥ million) | 50,200 | — | +0.4% |
| FY3/2027 guidance — operating profit (¥ million) | 1,500 | — | −37.6% |
| FY3/2027 guidance — ordinary profit (¥ million) | 1,700 | — | −36.5% |
| FY3/2027 guidance — net profit (¥ million) | 1,000 | — | −43.9% |
| FY3/2027 guidance — EPS (¥) | 102.68 | — | n.m. |
| Annual dividend per share (¥) | 50.00 | 47.00 | +6.4% |
JapanStockPulse provides informational content only and does not constitute investment advice. Figures are taken from the company's published earnings short report and may be subject to subsequent revision.