A very small base, and a very large multiple
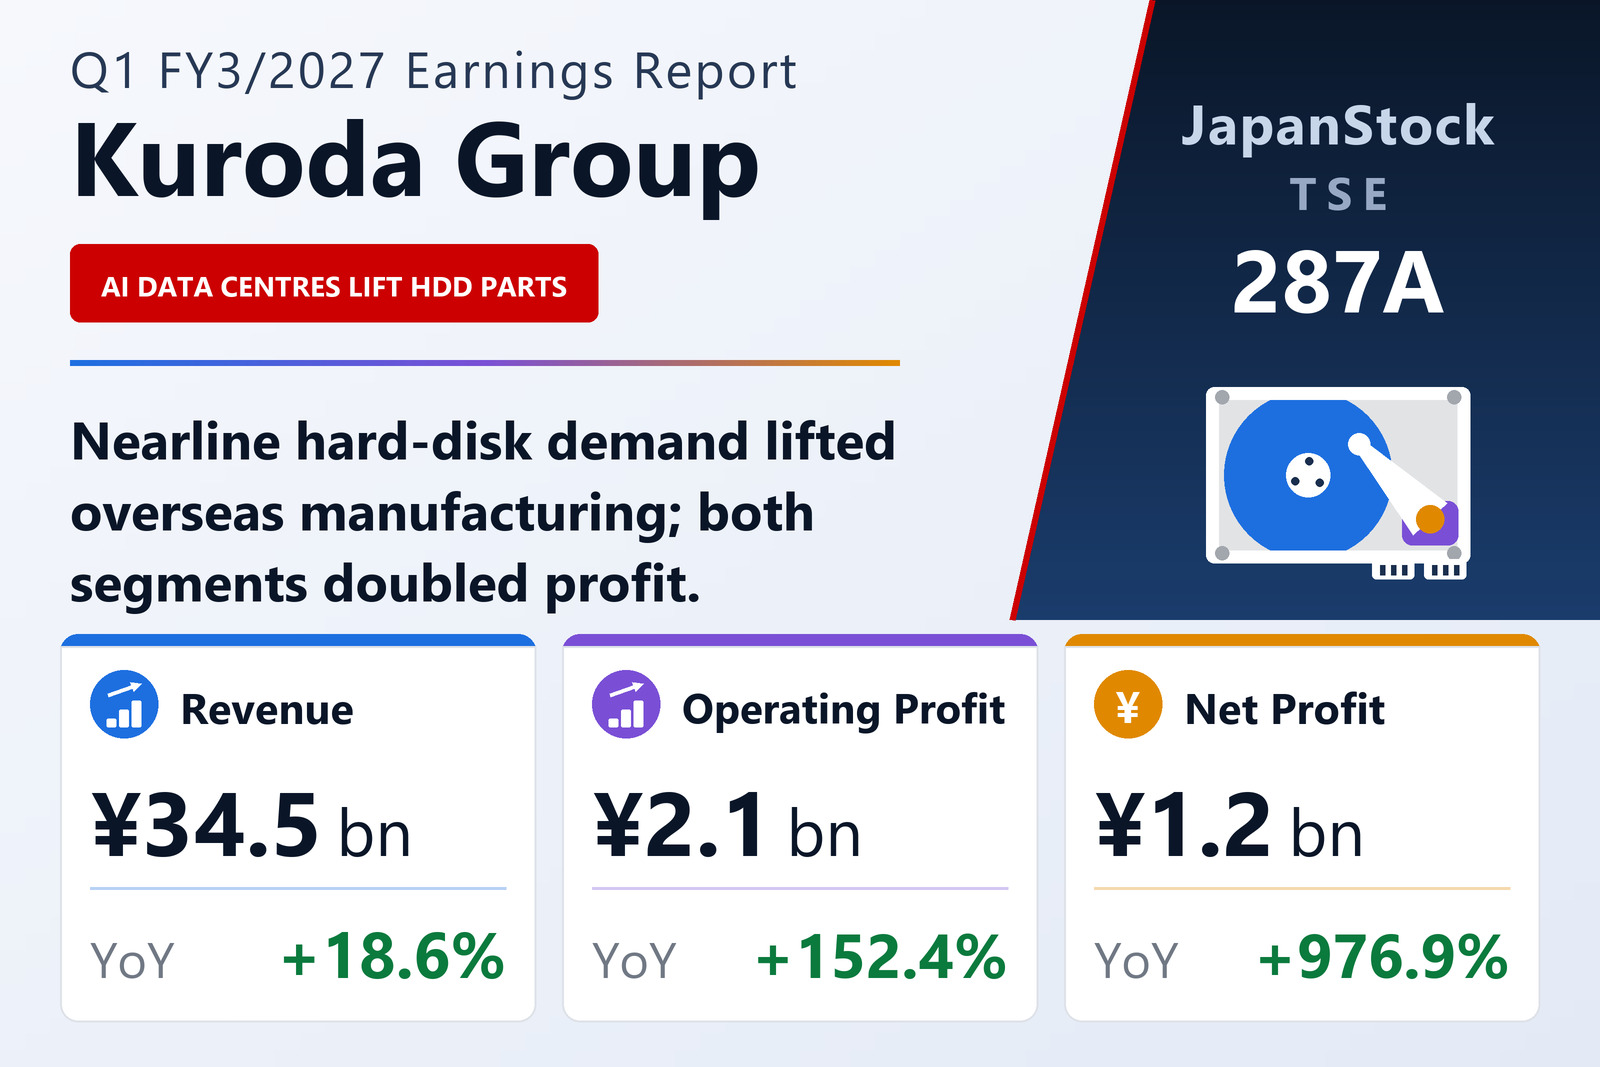
Kuroda Group Co., Ltd. (TSE: 287A) published consolidated results for the three months to June 30, 2026 on August 7, 2026 under IFRS. Revenue rose 18.6% to ¥34,490 million, operating profit 152.4% to ¥2,137 million, pre-tax profit 186.5% to ¥2,027 million and profit attributable to owners of the parent 976.9% to ¥1,215 million, for earnings per share of ¥28.63 against ¥2.66.
The last of those figures needs its base stated: a year earlier the company earned ¥113 million at the bottom line, so an elevenfold rise represents ¥1,102 million of absolute improvement, not a transformation of scale. The operating line is the more informative one — a margin of 6.2% against 2.9%. Comprehensive income swung to ¥2,007 million from a loss of ¥247 million.
Both halves of a deliberately unbalanced group
Kuroda runs to a stated basic policy of "group operation on a revenue mix of one part manufacturing to two parts trading", set out in its three-year plan covering FY3/2026 to FY3/2028. The quarter matched it closely: Manufacturing at ¥9,265 million of external revenue (+33.8%) against Trading at ¥25,226 million (+13.8%), a ratio of about 1 to 2.7.
Manufacturing lifted segment profit 96.7% to ¥1,324 million and Trading 175.3% to ¥1,247 million — so the smaller segment is now the more profitable of the two in absolute terms, on a third of the revenue. The plan also names portfolio management with a view to adding another manufacturing pillar, digital and technical capability aimed at higher value-add, and thorough localisation.
What actually sold
Within domestic manufacturing, the liquid-crystal production-materials business held revenue roughly flat while preparing Chinese production of alignment-film printing plates; automation equipment grew on continued strong orders for hard-disk-drive automation lines; electrical-installation materials rose on stronger sales of new and existing products and on customers buying ahead against raw-material price rises and feared shortages tied to the Middle East situation; and circuit design and contract development was roughly flat, centred on automotive circuit work.
The single clearest driver sits in overseas manufacturing: hard-disk-drive components, where the company reports continued strong demand for nearline models used in data centres as generative AI spreads, lifting sales across its component lines.
Balance sheet and guidance
Total assets rose 1.9% from the March year-end to ¥99,888 million and equity attributable to owners of the parent 1.7% to ¥41,855 million, leaving the ratio essentially unchanged at 41.9% against 42.0%.
Guidance for FY3/2027 is unchanged: revenue of ¥125,000 million (+1.8%), operating profit of ¥7,000 million (+7.1%), pre-tax profit of ¥6,400 million (+6.9%) and profit attributable to owners of the parent of ¥4,100 million (+16.4%), for earnings per share of ¥96.58. The quarter delivered 30.5% of the full-year operating-profit target, and the guidance implies revenue growth of well under 2% for the year against 18.6% in the quarter — a wide gap to watch. The annual dividend forecast rises to ¥63.00 per share from ¥61.00, split ¥31.00 interim and ¥32.00 year-end.
| Metric | Q1 FY3/2027 | Q1 FY3/2026 | Change |
|---|---|---|---|
| Revenue (¥ million) | 34,490 | 29,090 | +18.6% |
| Operating profit (¥ million) | 2,137 | 847 | +152.4% |
| Operating margin | 6.2% | 2.9% | +3.3 pt |
| Pre-tax profit (¥ million) | 2,027 | 708 | +186.5% |
| Net profit attrib. to owners of parent (¥ million) | 1,215 | 113 | +976.9% |
| Comprehensive income (¥ million) | 2,007 | −247 | loss to profit |
| EPS (¥) | 28.63 | 2.66 | +976.3% |
| Manufacturing — revenue (¥ million) | 9,265 | 6,925 | +33.8% |
| Manufacturing — segment profit (¥ million) | 1,324 | 673 | +96.7% |
| Trading — revenue (¥ million) | 25,226 | 22,165 | +13.8% |
| Trading — segment profit (¥ million) | 1,247 | 453 | +175.3% |
| Total assets (¥ million) | 99,888 | 97,985 | +1.9% |
| Equity attrib. to owners of parent (¥ million) | 41,855 | 41,140 | +1.7% |
| Equity ratio | 41.9% | 42.0% | −0.1 pt |
| FY3/2027 guidance — revenue (¥ million) | 125,000 | — | +1.8% |
| FY3/2027 guidance — operating profit (¥ million) | 7,000 | — | +7.1% |
| FY3/2027 guidance — pre-tax profit (¥ million) | 6,400 | — | +6.9% |
| FY3/2027 guidance — net profit (¥ million) | 4,100 | — | +16.4% |
| FY3/2027 guidance — EPS (¥) | 96.58 | — | n.m. |
| Annual dividend per share (¥) | 63.00 | 61.00 | +3.3% |
JapanStockPulse provides informational content only and does not constitute investment advice. Figures are taken from the company's published earnings short report and may be subject to subsequent revision.