Operating leverage, not margin, produced the 35.9%
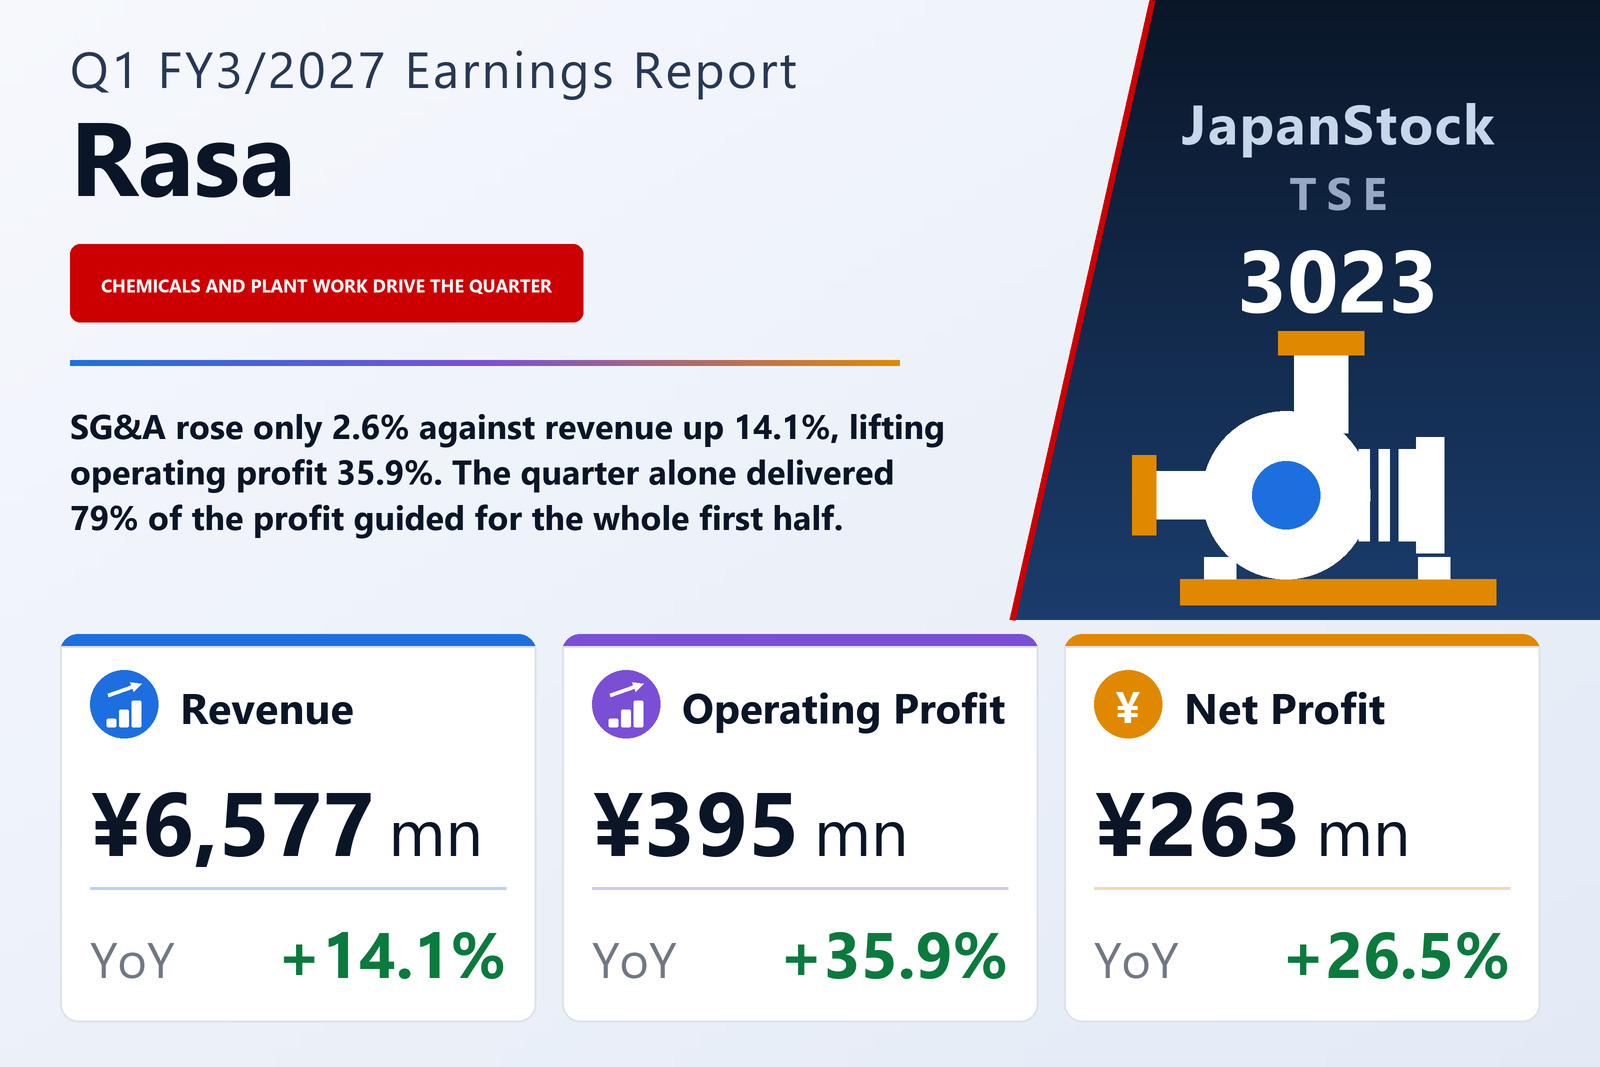
Rasa Corporation (TSE: 3023), the Tokyo-based specialist trading house in industrial machinery and mineral resources, published consolidated results for the three months to June 30, 2026 on August 7, 2026 under Japanese GAAP. Revenue rose 14.1% to ¥6,577 million, operating profit 35.9% to ¥395 million, ordinary profit 27.8% to ¥441 million and profit attributable to owners of the parent 26.5% to ¥263 million, for earnings of ¥24.97 per share against ¥19.37. Comprehensive income rose 52.3% to ¥450 million.
The mechanism is worth stating precisely, because this is not a margin story. Cost of sales grew 15.4%, faster than the 14.1% revenue increase, so the gross margin fell 0.9 points to 22.8% and gross profit rose only 9.7%, to ¥1,498 million. What produced the 35.9% operating increase was the expense line: selling, general and administrative expenses rose just 2.6% to ¥1,103 million against 14.1% revenue growth, and that gap lifted the operating margin to 6.0% from 5.0%. Pre-tax profit matched ordinary profit at ¥441 million and income taxes rose 30.0% to ¥178 million. For context, the year-earlier quarter had itself lifted operating profit 36.9% on a 2.7% revenue increase, with ordinary profit up 17.1% and net profit down 3.3%.
Chemical products and plant construction supplied the growth
Chemical Products was the largest single contributor, with revenue up 27.5% to ¥2,093 million — an increase of ¥451 million — and segment profit up 87.0% to ¥58 million. The company attributes it to recovering demand in the semiconductor-related wire and cable field and to higher market prices for the goods it handles.
Plant and Facility Construction grew fastest in percentage terms: revenue up 47.7% to ¥663 million, an increase of ¥214 million, and segment profit of ¥105 million against a segment loss of ¥30 million a year earlier. A large project was completed in the quarter and periodic repair work progressed smoothly. Between them the two segments account for essentially all of the group's revenue growth.
The machinery segment grew revenue and lost a third of its profit
Industrial and Construction Machinery, the second-largest segment by revenue, is the one place in this filing where the two lines diverge. Revenue rose 16.9% to ¥2,050 million, up ¥296 million, while segment profit fell 34.1% to ¥79 million, down ¥41 million. Sales of the company's mainstay pumps to private-sector customers fell, while recycling-plant construction projects and both sales and rentals of shield tunnelling machines, at home and abroad, went well. Profit fell anyway because one large project carried a high cost ratio — the same pattern that shows at group level, where cost of sales outgrew revenue.
Export controls, fewer overhauls, and a fully let building
Resources and Metal Materials fell 3.4% to ¥1,379 million, down ¥48 million, and its segment profit 31.2% to ¥34 million. The company names the cause: China tightened export controls, lengthening lead times on some of the raw materials it handles, and the revenue shortfall took the segment's profit down with it.
Environmental Equipment shrank hardest and still earned more. Revenue fell 24.4% to ¥326 million, down ¥105 million, on fewer large overhaul projects for piston pumps for private companies and electric utilities and fewer large private-sector orders for the imported specialist pumps it handles; segment profit nonetheless rose 34.3% to ¥63 million on lower selling and administrative expenses. Real Estate Leasing was small and steady: revenue of ¥100 million, up 4.5%, with the rental building fully occupied and tenant rents reviewed, and segment profit of ¥53 million, up 1.0%, held back by higher commission payments and facility management costs. Three of the six segments grew revenue; four of the six grew profit.
A smaller balance sheet and a higher equity ratio
Total assets fell 4.4% to ¥31,496 million from ¥32,952 million at March 31, 2026, while net assets were almost unchanged at ¥23,385 million, down 0.2%. Because the asset side contracted and equity did not, the equity ratio rose to 74.2% from 71.1%, a gain of 3.1 points. This filing does not break down which assets fell.
One quarter has already produced 79% of the half-year profit guide
Guidance is unchanged. The first half is forecast at revenue of ¥12,500 million (−1.2%), operating profit of ¥500 million (−46.4%), ordinary profit of ¥600 million (−41.0%) and profit attributable to owners of ¥400 million (−46.1%), for earnings of ¥37.95 per share. The full year is forecast at revenue of ¥28,500 million (+1.1%), operating profit of ¥2,500 million (−15.5%), ordinary profit of ¥2,750 million (−14.8%) and net profit of ¥2,000 million (−15.9%), for earnings of ¥189.90 per share. Set that against what has just been reported: the first quarter alone produced ¥395 million of the ¥500 million guided for the whole first half — 79% of it — inside a year guided to a 15.5% fall in operating profit. The company left the forecast where it was, and this filing gives no explanation for the second-quarter step down that the arithmetic implies.
The dividend is unchanged in total and rebalanced in shape. FY3/2027 is guided at ¥80.00 per share, the same as the ¥80.00 paid for FY3/2026, but the split is levelled: the interim rises to ¥40.00 from ¥36.00 and the year-end falls to ¥40.00 from ¥44.00. No revision to that forecast is recorded in this filing.
| Metric | Q1 FY3/2027 | Q1 FY3/2026 | Change |
|---|---|---|---|
| Revenue (¥ million) | 6,577 | 5,766 | +14.1% |
| Gross profit (¥ million) | 1,498 | 1,365 | +9.7% |
| Gross margin | 22.8% | 23.7% | −0.9 pt |
| SG&A expenses (¥ million) | 1,103 | 1,075 | +2.6% |
| Operating profit (¥ million) | 395 | 290 | +35.9% |
| Operating margin | 6.0% | 5.0% | +1.0 pt |
| Ordinary profit (¥ million) | 441 | 345 | +27.8% |
| Net profit attrib. to owners of parent (¥ million) | 263 | 208 | +26.5% |
| Comprehensive income (¥ million) | 450 | 295 | +52.3% |
| EPS (¥) | 24.97 | 19.37 | +28.9% |
| Resources and Metal Materials — revenue (¥ million) | 1,379 | 1,427 | −3.4% |
| Resources and Metal Materials — segment profit (¥ million) | 34 | 50 | −31.2% |
| Industrial and Construction Machinery — revenue (¥ million) | 2,050 | 1,753 | +16.9% |
| Industrial and Construction Machinery — segment profit (¥ million) | 79 | 121 | −34.1% |
| Environmental Equipment — revenue (¥ million) | 326 | 431 | −24.4% |
| Environmental Equipment — segment profit (¥ million) | 63 | 47 | +34.3% |
| Chemical Products — revenue (¥ million) | 2,093 | 1,641 | +27.5% |
| Chemical Products — segment profit (¥ million) | 58 | 31 | +87.0% |
| Plant and Facility Construction — revenue (¥ million) | 663 | 449 | +47.7% |
| Plant and Facility Construction — segment profit (¥ million) | 105 | −30 | loss to profit |
| Real Estate Leasing — revenue (¥ million) | 100 | 95 | +4.5% |
| Real Estate Leasing — segment profit (¥ million) | 53 | 53 | +1.0% |
| Total assets (¥ million) | 31,496 | 32,952 | −4.4% |
| Net assets (¥ million) | 23,385 | 23,433 | −0.2% |
| Equity ratio | 74.2% | 71.1% | +3.1 pt |
| FY3/2027 guidance — revenue (¥ million) | 28,500 | — | +1.1% |
| FY3/2027 guidance — operating profit (¥ million) | 2,500 | — | −15.5% |
| FY3/2027 guidance — ordinary profit (¥ million) | 2,750 | — | −14.8% |
| FY3/2027 guidance — net profit (¥ million) | 2,000 | — | −15.9% |
| FY3/2027 guidance — EPS (¥) | 189.90 | — | n.m. |
| Annual dividend per share (¥) | 80.00 | 80.00 | unchanged |
JapanStockPulse provides informational content only and does not constitute investment advice. Figures are taken from the company's published earnings short report and may be subject to subsequent revision.