Revenue passed ¥1 trillion for the nine months, and the margin widened
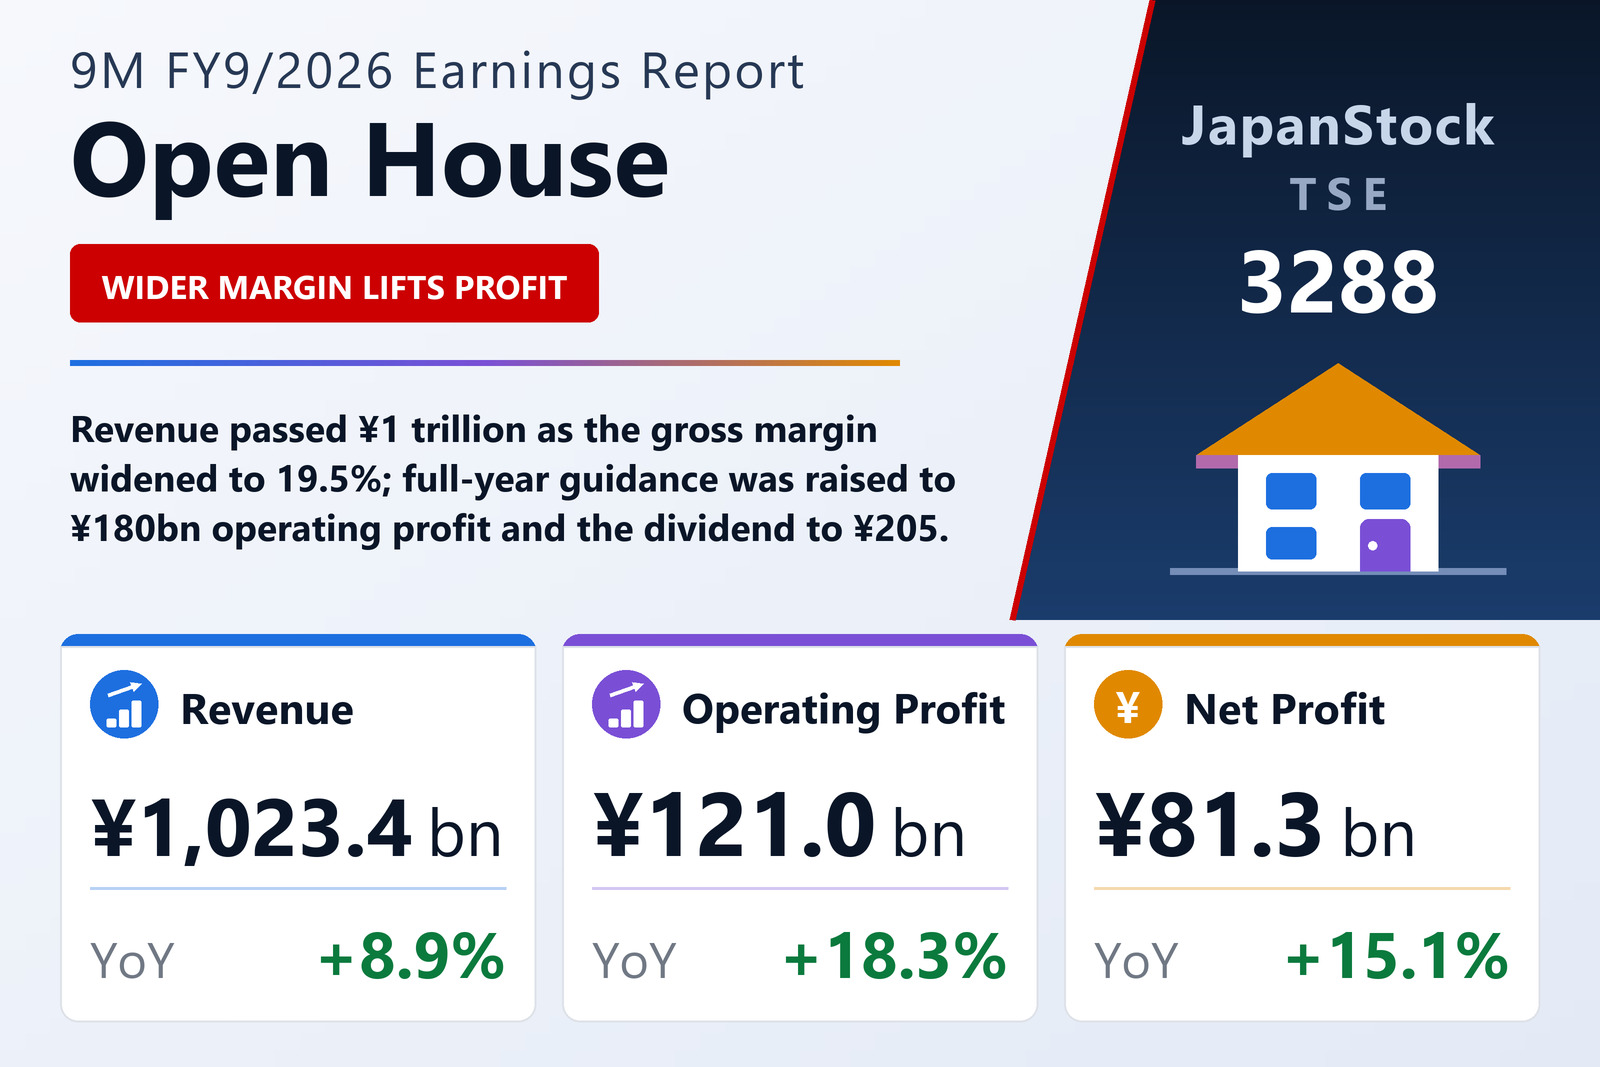
Open House Group Co., Ltd. (TSE: 3288), the real-estate group whose largest business is detached housing in Japan's urban areas, published consolidated results for the first nine months of its fiscal year ending September 30, 2026 — October 1, 2025 to June 30, 2026 — on August 7, 2026 under Japanese GAAP. Revenue rose 8.9% to ¥1,023,402 million, operating profit 18.3% to ¥120,959 million, ordinary profit 18.1% to ¥116,068 million and profit attributable to owners of the parent 15.1% to ¥81,260 million. Earnings per share were ¥727.21 against ¥610.44, up 19.1%. The filing lists the company on the Tokyo Stock Exchange.
The operating result comes from a spread rather than from volume. Cost of sales rose 7.5% to ¥823,932 million, more slowly than revenue, so gross profit rose 15.3% to ¥199,470 million and the gross margin widened from 18.4% to 19.5%. Selling, general and administrative expenses grew 10.9% to ¥78,510 million — faster than revenue but slower than gross profit — so the operating margin still moved up, from 10.9% to 11.8%. Operating profit therefore grew about twice as fast as revenue. The filing gives no group-level reason for the wider gross margin; its explanations are made segment by segment and speak of strong demand.
Higher interest costs and a missing one-off gain slowed the lines below
Interest expense rose 36.8% to ¥7,506 million from ¥5,486 million as borrowings grew, against interest income of ¥2,149 million (¥1,545 million a year earlier). Net non-operating costs came to ¥4,891 million against ¥4,005 million, so ordinary profit rose 18.1%, a little behind the operating line. The prior-year period also carried ¥5,696 million of extraordinary gains — ¥5,147 million from negative goodwill and ¥549 million from the sale of shares in affiliates — and this year carried none. Pre-tax profit therefore rose only 11.7%, to ¥116,068 million from ¥103,939 million, and income taxes rose 17.0% to ¥34,804 million.
Two items then pulled the bottom lines back up. Profit attributable to non-controlling interests fell to ¥2 million from ¥3,571 million, which is why profit attributable to owners (+15.1%) grew faster than pre-tax profit; the filing does not explain that change. And earnings per share grew faster still, +19.1%, because the average share count fell to 111,743,880 from 115,669,596. During the period the company cancelled treasury shares, reducing retained earnings and treasury stock by ¥21,980 million, and bought back ¥19,473 million of its own shares under a board resolution of November 14, 2025; issued shares fell from 120,709,700 to 116,735,700. Comprehensive income was ¥90,652 million, up 20.0%, lifted by a foreign-currency translation adjustment of ¥9,348 million against ¥1,310 million.
Detached housing carries the group; condominiums swing back to profit
Detached Housing-Related, the largest segment, grew revenue 8.7% to ¥563,006 million and segment profit 10.5% to ¥61,840 million. The filing says demand for detached houses remains high in the urban areas where the group operates, and that sales contracts leading to future deliveries are going well. Condominiums more than doubled revenue, up 123.3% to ¥42,415 million, and turned a segment loss of ¥280 million into a profit of ¥7,566 million. Even so, the company notes that its condominium deliveries are concentrated in the fourth quarter, so relatively few projects had been handed over by June 30, while sales contracts were progressing steadily.
Income Real Estate — rental apartments, office buildings and similar assets sold to business corporations and wealthy individuals — grew revenue 8.6% to ¥154,057 million and profit 12.1% to ¥16,370 million, on what the filing calls high demand. Other, which covers U.S. real estate sold to domestic wealthy investors seeking to diversify their assets, grew revenue 3.2% to ¥113,862 million, but profit slipped 1.0% to ¥13,380 million. Pressance, which sells investment and family condominiums in the Kinki and Tokai-Chukyo regions, saw revenue ease 0.3% to ¥150,047 million while profit rose 13.8% to ¥20,759 million. The subsidiary changed its name from Pressance Corporation to Pressance on April 1, 2026, and the segment was renamed with it; the filing says that is a change of name only. Segment revenues above are sales to external customers, and segment profits total ¥119,917 million before a ¥1,042 million adjustment.
Inventory built up, funded by cash and borrowing
Total assets rose ¥117,906 million to ¥1,529,908 million from September 30, 2025. Real estate for sale and real estate for sale in process rose by a combined ¥137,970 million and investments and other assets by ¥15,298 million, while cash and deposits fell ¥55,492 million to ¥366,406 million. Liabilities rose ¥68,189 million to ¥941,357 million, mainly because short- and long-term borrowings rose by a combined ¥82,867 million, partly offset by a ¥12,318 million fall in income taxes payable. Net assets grew ¥49,716 million to ¥588,551 million, as ¥81,260 million of profit outweighed ¥21,730 million of dividends paid, and the equity ratio edged up from 38.1% to 38.4%. No cash-flow statement was prepared for the nine months; depreciation was ¥1,713 million.
Guidance and dividend raised the same day
Open House Group revised its FY9/2026 forecasts in a separate release on August 7, 2026, citing recent business trends; the tanshin prints only the new figures, not the ones they replace. The company now expects revenue of ¥1,500,000 million (+12.2%), operating profit of ¥180,000 million (+23.3%), ordinary profit of ¥170,000 million (+21.9%) and profit attributable to owners of ¥118,500 million (+17.7%), for earnings per share of ¥1,062.61. The nine months delivered 68.2% of guided revenue, 67.2% of guided operating profit and 68.6% of guided net profit, which leaves an implied fourth quarter of about ¥476,598 million of revenue and ¥59,041 million of operating profit — the quarter in which, by the company's own account, condominium deliveries are concentrated.
The year-end dividend forecast was also revised, on the basis of recent performance and the company's shareholder-return policy, to ¥105.00. With ¥100.00 paid at the interim, the annual dividend would be ¥205.00 against ¥178.00 (¥84.00 plus ¥94.00) for FY9/2025, up 15.2% — about 19% of the guided earnings per share.
| Metric | 9M FY9/2026 | 9M FY9/2025 | Change |
|---|---|---|---|
| Revenue (¥ million) | 1,023,402 | 939,725 | +8.9% |
| Gross profit (¥ million) | 199,470 | 173,018 | +15.3% |
| Gross margin | 19.5% | 18.4% | +1.1 pt |
| SG&A expenses (¥ million) | 78,510 | 70,770 | +10.9% |
| Operating profit (¥ million) | 120,959 | 102,247 | +18.3% |
| Operating margin | 11.8% | 10.9% | +0.9 pt |
| Ordinary profit (¥ million) | 116,068 | 98,242 | +18.1% |
| Pre-tax profit (¥ million) | 116,068 | 103,939 | +11.7% |
| Net profit attrib. to owners of parent (¥ million) | 81,260 | 70,608 | +15.1% |
| EPS (¥) | 727.21 | 610.44 | +19.1% |
| Detached Housing-Related — revenue (¥ million) | 563,006 | 518,058 | +8.7% |
| Detached Housing-Related — segment profit (¥ million) | 61,840 | 55,984 | +10.5% |
| Condominiums — revenue (¥ million) | 42,415 | 18,991 | +123.3% |
| Condominiums — segment profit (¥ million) | 7,566 | −280 | loss to profit |
| Income Real Estate — revenue (¥ million) | 154,057 | 141,846 | +8.6% |
| Income Real Estate — segment profit (¥ million) | 16,370 | 14,599 | +12.1% |
| Other — revenue (¥ million) | 113,862 | 110,384 | +3.2% |
| Other — segment profit (¥ million) | 13,380 | 13,518 | −1.0% |
| Pressance — revenue (¥ million) | 150,047 | 150,430 | −0.3% |
| Pressance — segment profit (¥ million) | 20,759 | 18,249 | +13.8% |
| Total assets (¥ million) | 1,529,908 | 1,412,001 | +8.4% |
| Net assets (¥ million) | 588,551 | 538,834 | +9.2% |
| Equity ratio | 38.4% | 38.1% | +0.3 pt |
| FY9/2026 guidance — revenue (¥ million) | 1,500,000 | — | +12.2% |
| FY9/2026 guidance — operating profit (¥ million) | 180,000 | — | +23.3% |
| FY9/2026 guidance — ordinary profit (¥ million) | 170,000 | — | +21.9% |
| FY9/2026 guidance — net profit (¥ million) | 118,500 | — | +17.7% |
| FY9/2026 guidance — EPS (¥) | 1,062.61 | — | — |
| Annual dividend per share (¥) | 205.00 | 178.00 | +15.2% |
JapanStockPulse provides informational content only and does not constitute investment advice. Figures are taken from the company's published earnings short report and may be subject to subsequent revision.