A shrinking core and three growing edges
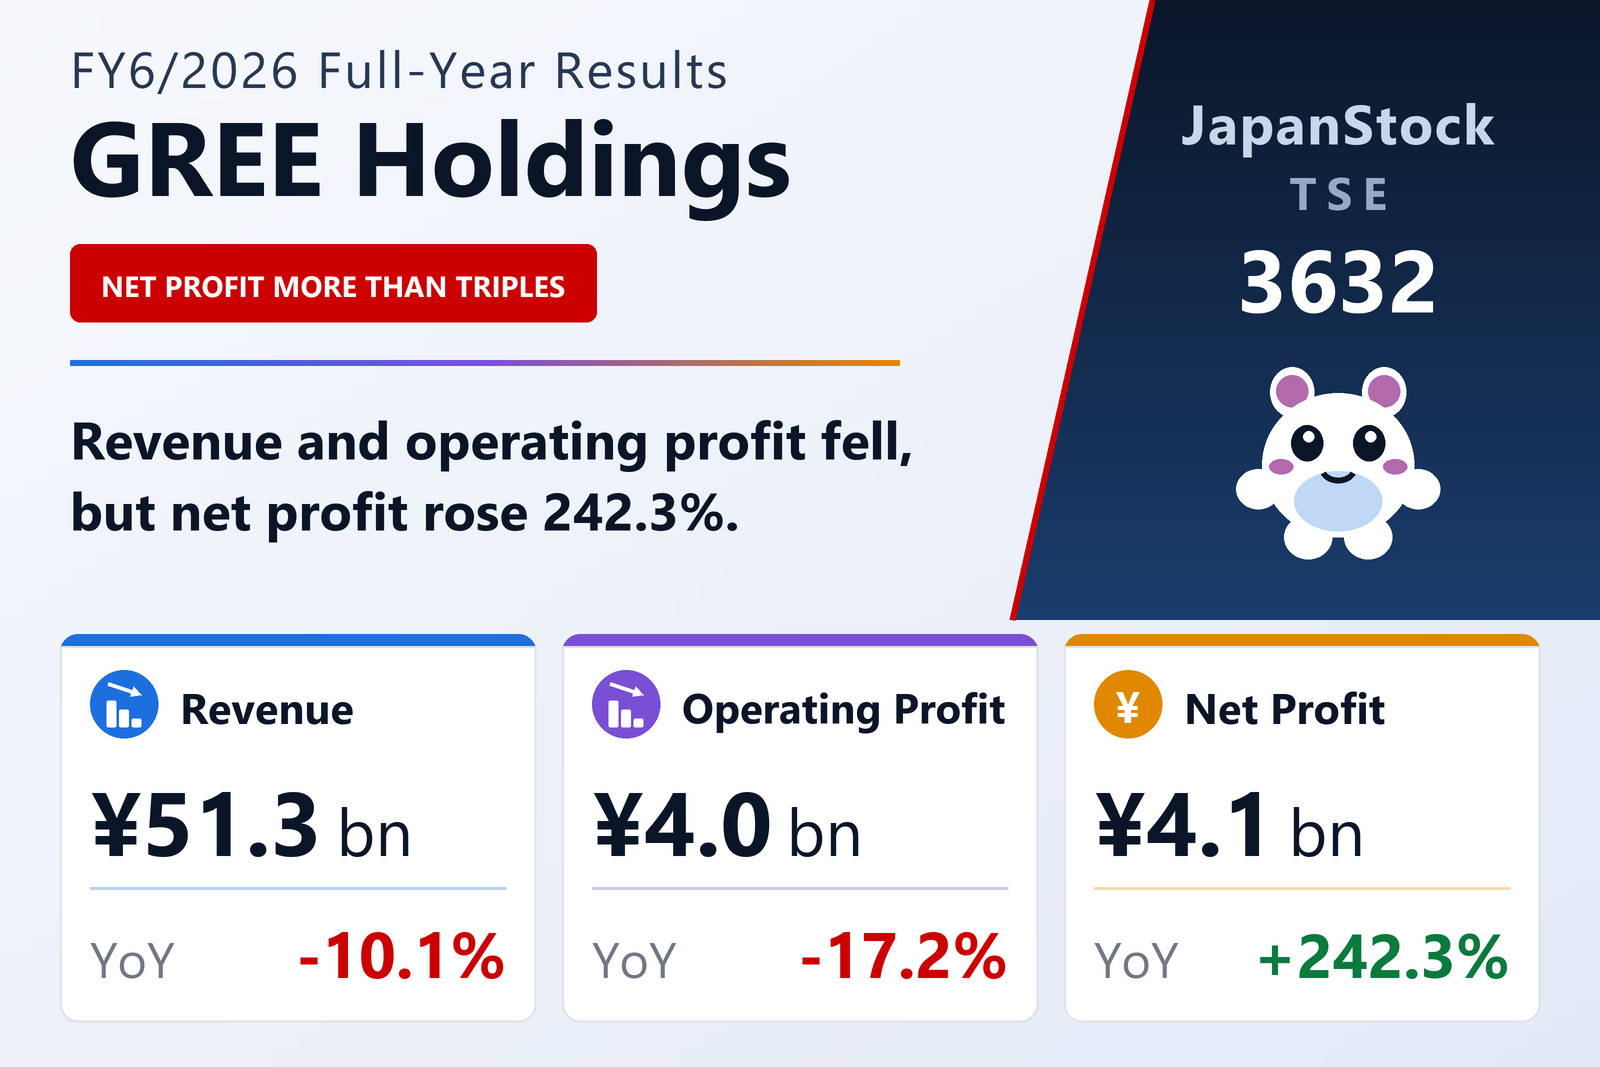
GREE Holdings, Inc. (TSE: 3632) published consolidated results for the year to June 30, 2026 on August 7, 2026 under Japanese GAAP. Revenue fell 10.1% to ¥51,324 million and operating profit 17.2% to ¥4,026 million, narrowing the operating margin from 8.5% to 7.8%. Ordinary profit, however, rose 31.3% to ¥4,936 million on much larger foreign-exchange gains, and net profit attributable to owners of the parent rose 242.3% to ¥4,088 million, for earnings per share of ¥23.82 against ¥6.98.
Two reporting changes frame the segment table. The former Metaverse segment was renamed VTuber to describe its content more accurately — a name change only, with no effect on the numbers — and the shared technology function previously sitting in Other was carved out into a new Engineering segment as it grew materially. Prior-year figures are restated on the new basis.
Games still supply 57% of revenue, and all of the decline
The game segment fell 20.3% to ¥29,439 million of revenue and 19.2% to ¥3,712 million of profit. The company describes a year run mainly on existing titles while it stabilises them for long-term operation and develops new ones — soft, in its own word. Games still account for 57% of segment revenue and 60% of segment profit, so a 20% decline there sets the group's headline direction on its own.
VTuber was the counterweight: revenue up 10.7% to ¥9,164 million and profit up 125.1% to ¥1,486 million as the group expanded content and features on REALITY and kept investing in its production business. Engineering, the newly separated segment, grew revenue 328.7% to ¥1,321 million and profit 306.3% to ¥712 million after the group began selling externally the development and operations know-how built up over years of internal use. DX grew revenue 5.3% to ¥7,414 million and profit 5.6% to ¥974 million, on plan, while continuing to invest in a shift to a recurring-revenue structure.
Two segments went backwards. IP grew revenue 4.3% to ¥1,812 million but swung to a ¥23 million operating loss from a ¥282 million profit, as licensing was soft and the segment kept investing in a full-scale launch of new businesses. Investment revenue fell 21.7% to ¥2,621 million and its loss widened to ¥715 million from ¥413 million, on lower distributions from investee funds and revaluation effects on shares those funds hold.
Cash out the door, and a much stronger balance sheet
Total assets fell ¥7,349 million to ¥125,547 million. Within current assets, securities rose ¥9,222 million, operational investment securities ¥3,233 million and cash ¥1,570 million, while monetary trusts fell ¥16,500 million and receivables ¥1,347 million. Liabilities fell ¥10,507 million to ¥28,743 million, chiefly on the redemption of ¥3,000 million of bonds due within a year and ¥6,000 million of longer bonds.
Net assets rose ¥3,157 million to ¥96,804 million, taking the equity ratio to 75.8% from 70.0% and the current ratio to 649.8%. Operating cash flow was an inflow of ¥1,970 million against ¥674 million; investing used ¥1,539 million against an inflow of ¥312 million; and financing used ¥10,882 million, against an inflow of ¥6,023 million a year earlier, on ¥9,000 million of bond redemptions and ¥2,479 million of dividends. Cash and equivalents closed at ¥74,194 million, down ¥9,706 million.
Guidance covers only two lines — deliberately
For FY6/2027 the company guides to revenue of ¥51,000 million (−0.6%) and operating profit of ¥3,900 million (−3.1%). It does not publish ordinary or net profit guidance, on the stated grounds that valuation swings on non-operating investment activity cannot be reasonably estimated — which is a fair reading of a year in which those very items turned a 17.2% operating decline into a 242.3% rise in net profit.
On dividends the policy is a DOE of about 4% with a consolidated payout ratio of roughly 30% or more. For FY6/2026 the company will pay ¥22.00 per share as a single year-end dividend, against ¥14.50 for FY6/2025 — of which ¥10.00 was a commemorative dividend and ¥4.50 ordinary. For FY6/2027 it plans to move to twice-yearly payments, ¥11.00 interim and ¥11.00 year-end, for the same ¥22.00 total.
| Metric | FY6/2026 | FY6/2025 | Change |
|---|---|---|---|
| Net sales (¥ million) | 51,324 | 57,111 | −10.1% |
| Operating profit (¥ million) | 4,026 | 4,860 | −17.2% |
| Operating margin | 7.8% | 8.5% | −0.7 pt |
| Ordinary profit (¥ million) | 4,936 | 3,760 | +31.3% |
| Net profit attrib. to owners of parent (¥ million) | 4,088 | 1,194 | +242.3% |
| Comprehensive income (¥ million) | 4,266 | 650 | +555.9% |
| EPS (¥) | 23.82 | 6.98 | +241.3% |
| Game — revenue (¥ million) | 29,439 | 36,936 | −20.3% |
| Game — segment profit (¥ million) | 3,712 | 4,596 | −19.2% |
| VTuber — revenue (¥ million) | 9,164 | 8,276 | +10.7% |
| VTuber — segment profit (¥ million) | 1,486 | 660 | +125.1% |
| IP — revenue (¥ million) | 1,812 | 1,737 | +4.3% |
| IP — segment profit (¥ million) | −23 | 282 | profit to loss |
| DX — revenue (¥ million) | 7,414 | 7,041 | +5.3% |
| DX — segment profit (¥ million) | 974 | 922 | +5.6% |
| Engineering — revenue (¥ million) | 1,321 | 308 | +328.7% |
| Engineering — segment profit (¥ million) | 712 | 175 | +306.3% |
| Investment — revenue (¥ million) | 2,621 | 3,346 | −21.7% |
| Investment — segment profit (¥ million) | −715 | −413 | loss widened |
| Total assets (¥ million) | 125,547 | 132,897 | −5.5% |
| Net assets (¥ million) | 96,804 | 93,647 | +3.4% |
| Equity ratio | 75.8% | 70.0% | +5.8 pt |
| FY6/2027 guidance — revenue (¥ million) | 51,000 | — | −0.6% |
| FY6/2027 guidance — operating profit (¥ million) | 3,900 | — | −3.1% |
| Annual dividend per share (¥) | 22.00 | 14.50 | +51.7% |
JapanStockPulse provides informational content only and does not constitute investment advice. Figures are taken from the company's published earnings short report and may be subject to subsequent revision.