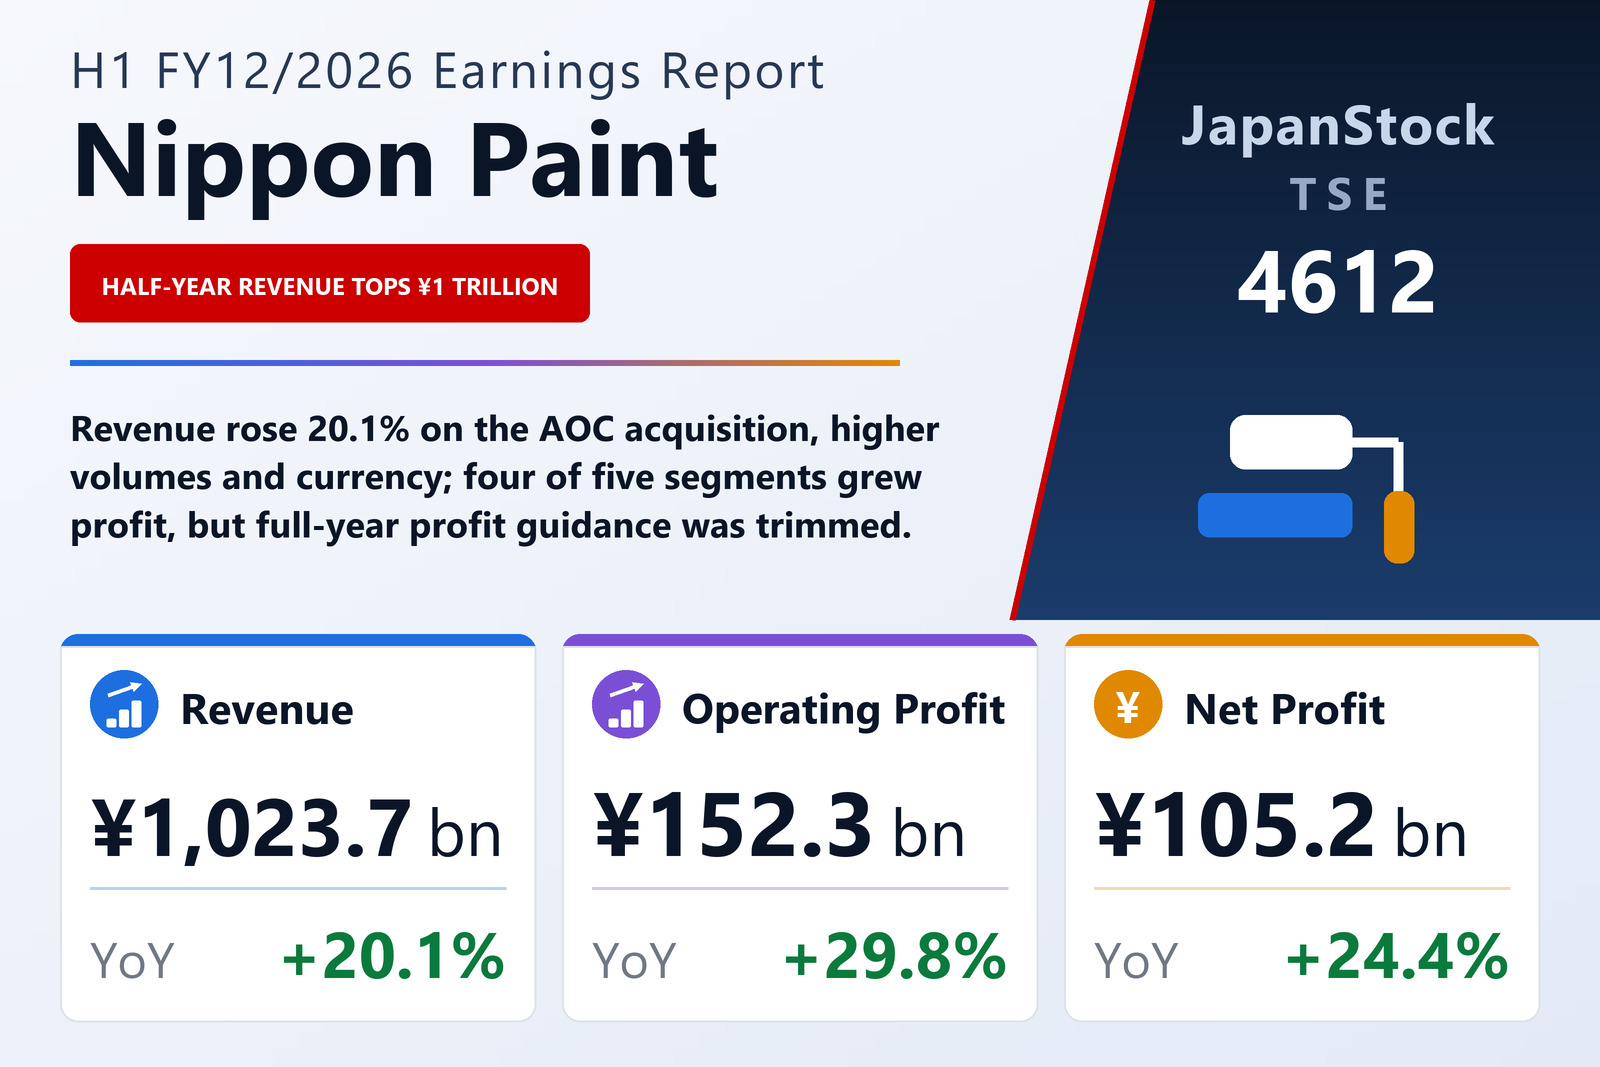
Revenue passes ¥1 trillion for the half
Nippon Paint Holdings Co., Ltd. (TSE: 4612) published consolidated results for the six months from January 1 to June 30, 2026 on August 7, 2026 under IFRS. Revenue rose 20.1% to ¥1,023,683 million, operating profit 29.8% to ¥152,315 million and pre-tax profit 28.6% to ¥144,254 million. Profit attributable to owners of the parent rose 24.4% to ¥105,150 million, and basic earnings per share came to ¥45.30 against ¥35.98.
The filing attributes the growth to the contribution of AOC — LSF11 A5 TopCo LLC, a specialty formulator for coatings-related products with leading positions in the U.S. and European markets — together with higher sales volumes and currency effects. AOC has been consolidated since its acquisition on March 3, 2025, so the prior-year half included its results only from that date. Those prior-year figures have also been restated to reflect the finalization of the provisional purchase accounting for the deal.
Gross margin widens, overheads held
Cost of sales rose 17.1% to ¥580,492 million, slower than revenue, lifting gross profit 24.2% to ¥443,191 million and the gross margin to 43.3% from 41.9%. Selling, general and administrative expenses rose 18.7% to ¥288,675 million, easing to 28.2% of revenue from 28.5%. Other income fell to ¥4,896 million from ¥6,365 million while other expenses rose to ¥7,096 million from ¥2,605 million, so the net other line swung from a gain of ¥3,760 million to a charge of ¥2,200 million; the filing does not itemize it. The operating margin still widened to 14.9% from 13.8%.
Below operating profit, finance costs rose to ¥17,865 million from ¥14,173 million against finance income of ¥8,336 million (¥8,010 million a year earlier), and equity-method income was ¥1,467 million. Income taxes rose to ¥38,457 million, taking the effective rate to about 26.7% from 23.6%, which is why net profit grew more slowly than operating profit. Profit attributable to non-controlling interests fell to ¥646 million from ¥1,240 million.
Four of five segments grew profit
All five reportable segments grew revenue from external customers. NIPSEA, by far the largest, lifted revenue 15.0% to ¥504,172 million and segment profit 25.1% to ¥86,511 million: automotive coatings grew on strong sales to Chinese local carmakers despite lower vehicle production in China and Thailand, and decorative paints grew on higher volumes in Malaysia, Singapore, Indonesia and Türkiye. Japan grew revenue 13.3% to ¥114,063 million and profit 45.3% to ¥14,399 million, on higher vehicle output, price increases and demand captured amid tight raw-material supply.
AOC revenue rose 66.2% to ¥107,608 million and profit 77.8% to ¥34,072 million, on higher volumes and price increases in what the filing calls a still-difficult macroeconomic environment. The Americas grew revenue 9.1% to ¥65,479 million and profit 8.1% to ¥4,224 million, as automotive share gains, price increases and currency offset weak U.S. housing demand. DuluxGroup was the exception: revenue rose 23.2% to ¥232,359 million on a better product mix, growth in Central Europe and small acquisitions, but segment profit fell 10.2% to ¥16,489 million, which the filing attributes to a higher SG&A ratio.
Cash flow recovers; balance sheet grows on currency
Operating cash flow rose to ¥105,830 million from ¥18,674 million, as the build-up in trade receivables was smaller than a year earlier. Investing activities used ¥30,279 million against ¥290,348 million in the prior-year half, when the AOC purchase absorbed ¥300,244 million, and financing activities used ¥38,304 million, including ¥18,622 million of dividends. Cash and cash equivalents ended the half at ¥477,268 million.
Total assets rose 6.8% from the December year-end to ¥4,289,463 million, with goodwill up to ¥1,517,974 million. Equity attributable to owners of the parent rose 11.0% to ¥2,001,942 million, mainly on foreign-currency translation, lifting the equity ratio to 46.7% from 44.9%. Bonds and borrowings totalled ¥1,420,886 million.
Revenue guidance raised, profit guidance trimmed
Alongside the results the company revised the full-year FY12/2026 forecast it published on February 13, 2026. Revenue guidance rises by ¥80,000 million to ¥2,000,000 million (+12.7% year on year) and operating profit stays at ¥283,000 million (+10.1%), but pre-tax profit is cut by ¥9,000 million to ¥265,000 million (+5.8%) and profit attributable to owners of the parent by ¥9,000 million to ¥189,000 million (+5.1%), for earnings per share of ¥81.45 against ¥85.34 previously. The filing refers readers to a separate same-day notice for the reasons.
The first half already accounts for 51.2% of the full-year revenue target and 53.8% of the operating-profit target. The interim dividend is ¥8.00 per share, payable from September 11, 2026, and the year-end forecast of ¥9.00 brings the annual total to ¥17.00 against ¥16.00.
Subsequent event: buying back European automotive coatings
On August 7, 2026 the board resolved to reacquire the European automotive coatings business the company sold in 2021 to the Wuthelam group — its major shareholder Nipsea International Limited, Goh Hup Jin and the entities they control — and signed a share purchase agreement the same day. The filing says the business has recovered under Wuthelam's restructuring and is now expected to keep growing profit. The price, set on the basis of an independent third-party valuation, is about €47 million (about ¥8.5 billion at ¥181.4 to the euro), with completion expected in October 2026. The India business sold in the same 2021 transaction was bought back in November 2024.
| Metric | H1 FY12/2026 | H1 FY12/2025 | Change |
|---|---|---|---|
| Revenue (¥ million) | 1,023,683 | 852,428 | +20.1% |
| Gross profit (¥ million) | 443,191 | 356,785 | +24.2% |
| Gross margin | 43.3% | 41.9% | +1.4 pt |
| SG&A expenses (¥ million) | 288,675 | 243,227 | +18.7% |
| Operating profit (¥ million) | 152,315 | 117,317 | +29.8% |
| Operating margin | 14.9% | 13.8% | +1.1 pt |
| Pre-tax profit (¥ million) | 144,254 | 112,187 | +28.6% |
| Net profit attrib. to owners of parent (¥ million) | 105,150 | 84,502 | +24.4% |
| Comprehensive income (¥ million) | 226,141 | −62,927 | n.m. |
| EPS (¥) | 45.30 | 35.98 | +25.9% |
| Japan — revenue (¥ million) | 114,063 | 100,644 | +13.3% |
| Japan — segment profit (¥ million) | 14,399 | 9,912 | +45.3% |
| NIPSEA — revenue (¥ million) | 504,172 | 438,379 | +15.0% |
| NIPSEA — segment profit (¥ million) | 86,511 | 69,133 | +25.1% |
| DuluxGroup — revenue (¥ million) | 232,359 | 188,610 | +23.2% |
| DuluxGroup — segment profit (¥ million) | 16,489 | 18,359 | −10.2% |
| Americas — revenue (¥ million) | 65,479 | 60,041 | +9.1% |
| Americas — segment profit (¥ million) | 4,224 | 3,905 | +8.1% |
| AOC — revenue (¥ million) | 107,608 | 64,753 | +66.2% |
| AOC — segment profit (¥ million) | 34,072 | 19,162 | +77.8% |
| Total assets (¥ million) | 4,289,463 | 4,017,738 | +6.8% |
| Equity attrib. to owners of parent (¥ million) | 2,001,942 | 1,803,859 | +11.0% |
| Equity ratio | 46.7% | 44.9% | +1.8 pt |
| FY12/2026 guidance — revenue (¥ million) | 2,000,000 | — | +12.7% |
| FY12/2026 guidance — operating profit (¥ million) | 283,000 | — | +10.1% |
| FY12/2026 guidance — pre-tax profit (¥ million) | 265,000 | — | +5.8% |
| FY12/2026 guidance — net profit (¥ million) | 189,000 | — | +5.1% |
| FY12/2026 guidance — EPS (¥) | 81.45 | — | n.m. |
| Annual dividend per share (¥) | 17.00 | 16.00 | +6.3% |
JapanStockPulse provides informational content only and does not constitute investment advice. Figures are taken from the company's published earnings short report and may be subject to subsequent revision.