Nine months that have already delivered most of the year
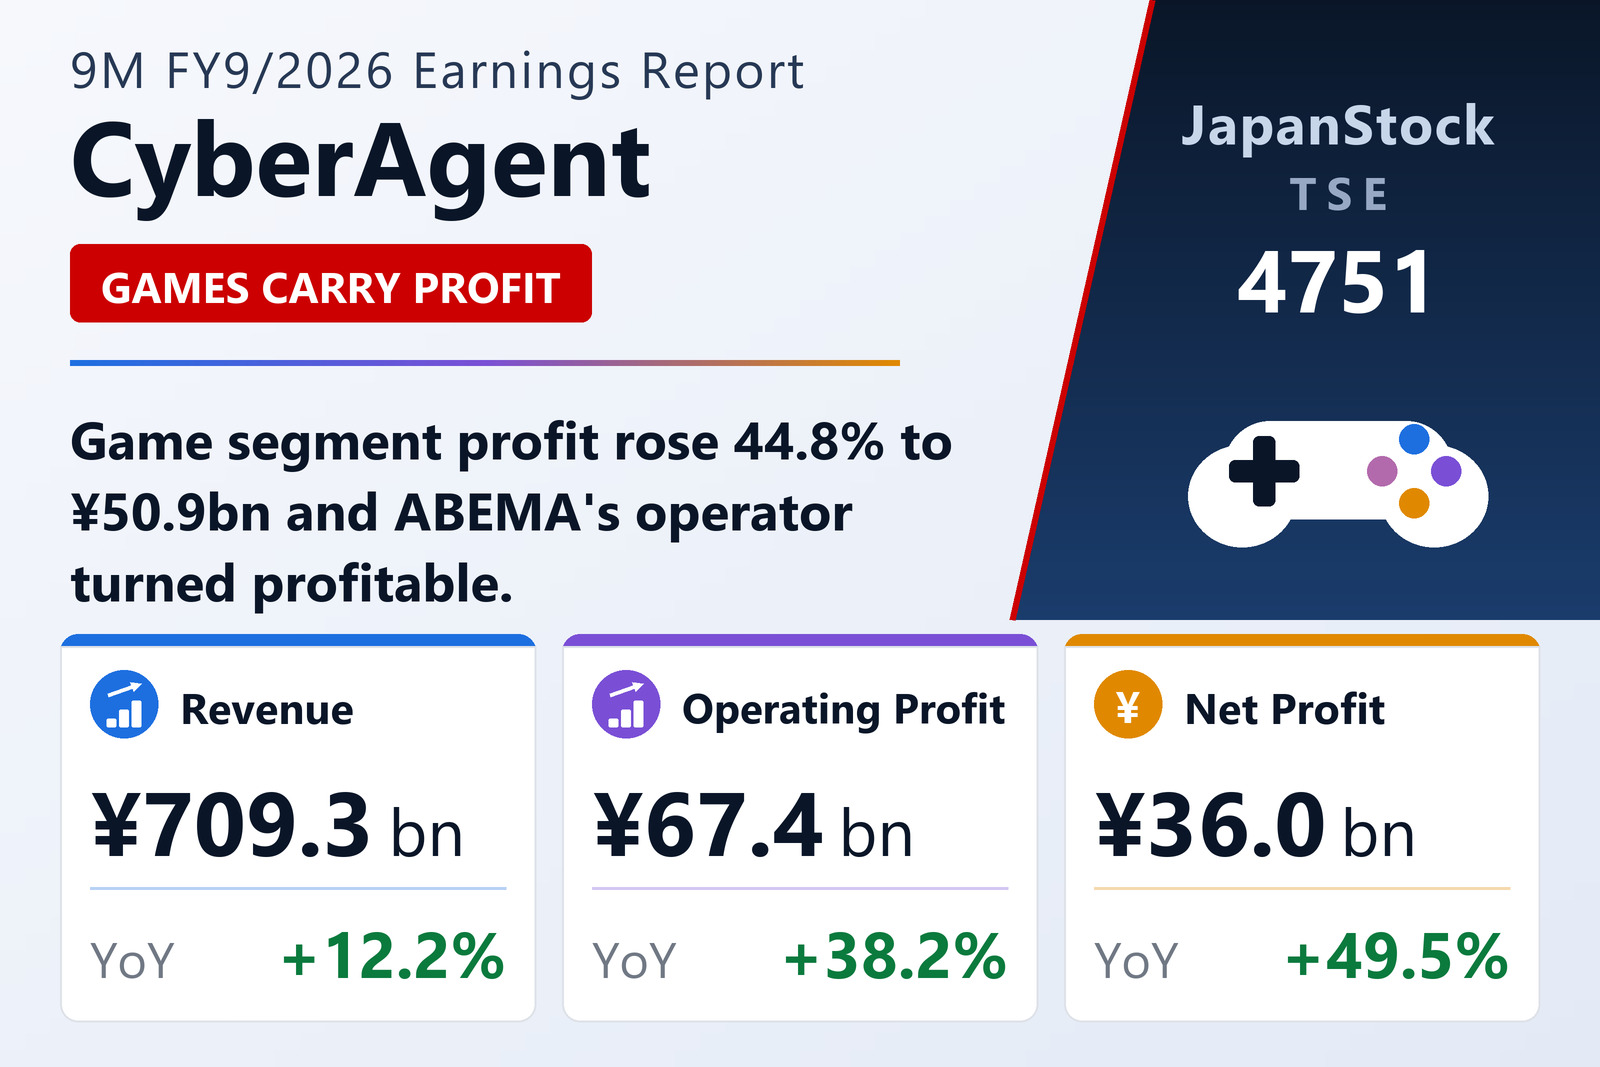
CyberAgent, Inc. (TSE: 4751), the Tokyo-listed internet group led by President Takahiro Yamauchi, published its third-quarter results for the year to September 2026 on August 7, 2026, covering the nine months from October 1, 2025 to June 30, 2026 under Japanese GAAP on a consolidated basis. Net sales rose 12.2% to ¥709,272 million from ¥631,993 million, an acceleration on the 5.8% growth recorded in the same period a year earlier. Every profit line rose considerably faster than the top line: operating profit was up 38.2% to ¥67,449 million, ordinary profit up 42.3% to ¥69,182 million, and profit attributable to owners of the parent up 49.5% to ¥36,035 million. Basic earnings per share came in at ¥71.07 against ¥47.59, with diluted EPS of ¥67.10 against ¥44.88. Comprehensive income rose 37.8% to ¥42,422 million.
The mechanics of that operating leverage are visible in the cost lines. Cost of sales rose 9.0% to ¥489,186 million, well below the 12.2% growth in sales, so gross profit advanced 20.1% to ¥220,086 million and the gross margin widened to 31.0% from 29.0%. Selling, general and administrative expenses grew 13.5% to ¥152,636 million — faster than gross profit could have absorbed in a flat year, but comfortably slower than gross profit itself grew. The result was an operating margin of 9.5%, against 7.7% a year earlier.
Below the operating line, non-operating income of ¥2,506 million more than doubled from ¥1,181 million, driven by a ¥965 million foreign exchange gain, interest income of ¥512 million against ¥287 million, dividend income of ¥477 million and ¥72 million of equity-method investment income. Non-operating expenses fell to ¥773 million from ¥1,348 million, the prior year having carried a ¥146 million equity-method investment loss and ¥889 million of other charges against none and ¥402 million this time; interest expense itself rose, to ¥370 million from ¥312 million. On a net basis the non-operating lines contributed ¥1,733 million this period against a ¥167 million drag a year earlier, and that swing is why ordinary profit grew faster (42.3%) than operating profit (38.2%). Extraordinary items were quieter than last year in both directions: extraordinary income of ¥93 million against ¥2,260 million, the prior-year figure having been dominated by a ¥1,703 million gain on sale of fixed assets, and extraordinary loss of ¥2,412 million against ¥4,135 million — of which impairment losses accounted for ¥1,318 million this period and ¥3,892 million last.
Profit before income taxes was ¥66,863 million against ¥46,756 million, and income taxes of ¥20,855 million left profit of ¥46,007 million versus ¥30,015 million. The effective tax burden lightened to 31.2% of pre-tax profit from 35.8%. One line then takes a meaningful bite: profit attributable to non-controlling interests jumped to ¥9,972 million from ¥5,912 million, so a little over one-fifth of consolidated profit accrued to minority holders in CyberAgent's part-owned subsidiaries rather than to the parent's shareholders. Even after that, the attributable figure still rose 49.5%.
Game: two-thirds of segment profit
The Game segment — which houses Cygames, Applibot, QualiArts, Colorful Palette and Sumzap among others — was the single largest driver of the result. Segment revenue rose 37.8% to ¥193,391 million from ¥140,364 million, and segment profit rose 44.8% to ¥50,923 million from ¥35,162 million. The company attributes the strength to its flagship titles performing well alongside a casual game that became a global hit.
The scale of the segment's contribution is worth stating plainly. Reportable-segment profit across all four businesses totalled ¥77,878 million; Game supplied 65.4% of it. On revenue the segment is a distant second — its ¥193,038 million of external sales is 27.2% of group net sales — so the profit share is a function of margin rather than size. Game ran a segment margin of 26.3%, up from 25.1%, against 4.2% in Internet Advertising and 7.2% in Media & IP. Put another way, Game generated more segment profit on its own than the other three businesses combined generated in revenue-weighted terms, and it is the reason a 12.2% sales increase became a 38.2% operating-profit increase.
That concentration is also the group's clearest risk. Mobile game earnings depend on the performance of individual titles, and the release notes ¥720 million of impairment losses within the Game segment during the nine months arising from reduced profitability and the discontinuation of certain services — the largest of the period's impairments by segment, and a routine reminder that titles are written down when they stop working.
Media & IP: AbemaTV turns profitable and nearly doubles segment earnings
The Media & IP segment — ABEMA, WINTICKET, the Anime & IP Division, Cypic Inc. and others — grew revenue 8.9% to ¥183,931 million, of which ¥171,098 million was external and ¥12,832 million internal. Segment profit rose 88.0% to ¥13,178 million from ¥7,008 million, and the company attributes that surge largely to AbemaTV, Inc. turning profitable. The segment's margin roughly doubled, to 7.2% from 4.1%.
For a business that has spent a decade being the group's most visible investment, that is a structural change rather than a quarter's noise. ABEMA launched in 2016 as what the company calls "the new future television," and the group states that it aims to expand around that asset. The release adds a second strand: it observes that IP businesses built on media-mix strategies are growing rapidly both in Japan and globally, and that the group is deliberately strengthening IP businesses with a high affinity for ABEMA. In other words, the segment is being managed as a platform plus a content library that feed each other, rather than as a streaming service alone. Media & IP also absorbed ¥383 million of impairment losses in the period.
What the release does not provide — and what this article will therefore not supply — is any viewer, subscriber or engagement metric for ABEMA, or any breakdown of the segment between the media and the IP halves. The ¥13,178 million is the whole of what is disclosed.
Internet Advertising: the biggest business by revenue, but profit slipped
Internet Advertising, which contains the Internet Advertising Division and the AI Division, remains comfortably the group's largest business by revenue: ¥363,687 million in the nine months, up 4.9%, of which ¥344,892 million was external — 48.6% of group net sales. Segment profit, however, went the other way, edging down 1.7% to ¥15,425 million from ¥15,697 million, so the segment margin narrowed to 4.2% from 4.5%. It is the only one of the three core businesses whose profit declined.
The one forward-looking note the company offers on this business is that, since the immediately preceding quarter, it has sustained a high revenue growth rate on a year-on-year quarterly basis. That is a statement about the top line, not the margin, and the nine-month cumulative figures show the top line growing at less than half the group's overall rate. Investors reading the group's 38.2% operating-profit increase should be clear that almost half of CyberAgent's revenue sits in a business that contributed 19.8% of reportable-segment profit and grew that profit not at all. The segment carried ¥214 million of impairment losses in the period.
The fourth reportable segment, Investment Development — corporate venture capital and fund management conducted at CyberAgent Capital — shrank sharply. Revenue fell 83.0% to ¥243 million from ¥1,435 million and the segment posted a loss of ¥1,648 million, widening from a ¥860 million loss a year earlier. It is small enough not to move the group result, but it is the one business that got materially worse on both lines.
Balance sheet: a smaller book, a much stronger equity ratio
Total assets fell ¥5,989 million from the September 2025 year-end to ¥551,172 million, mainly on a decline in cash and deposits following income-tax and dividend payments; cash and deposits ended at ¥212,081 million against ¥229,849 million. Liabilities came down considerably faster, ¥28,206 million to ¥253,275 million, principally because accrued income taxes fell to ¥7,737 million from ¥20,797 million once those tax payments were made. Net assets rose ¥22,216 million to ¥297,897 million, driven by retained earnings, which advanced to ¥173,615 million from ¥146,260 million on the period's profit.
The combination — a slightly smaller balance sheet, materially less debt-like liability, more retained profit — produced a marked improvement in capital structure. Shareholders' equity rose to ¥204,990 million from ¥179,992 million and the equity ratio improved to 37.2% from 32.3%, a gain of 4.9 percentage points in nine months. Two funding items sit alongside that: the group now carries ¥40,239 million of convertible bonds with share acquisition rights, where it had none at the September year-end, and long-term borrowings rose to ¥54,616 million from ¥40,353 million. The convertible issue is also the reason diluted EPS of ¥67.10 sits 5.6% below basic EPS of ¥71.07 — a dilution gap that widened slightly from the prior year's 5.7%. Goodwill was broadly unchanged at ¥13,852 million.
Depreciation for the nine months was ¥8,580 million, up from ¥6,209 million — a 38.2% increase that points to a heavier fixed-asset base being built behind the reported profit — with goodwill amortisation of ¥637 million, effectively flat on ¥641 million. No quarterly consolidated statement of cash flows was prepared, so cash generation cannot be examined directly for the period. Shares issued including treasury stood at 507,105,370 against 506,779,600 at the year-end, with 1,108 treasury shares and an average of 506,991,569 shares for the period.
Revised guidance, a raised dividend — and a very light implied fourth quarter
CyberAgent revised its full-year guidance on August 7, 2026, replacing the forecast published on November 14, 2025, and issued a separate release the same day covering both that revision and a revision to the dividend forecast. For the year to September 2026 the company now targets net sales of ¥950,000 million, up 8.7%, operating profit of ¥77,000 million, up 7.4%, ordinary profit of ¥78,000 million, up 8.7%, and profit attributable to owners of the parent of ¥41,000 million, up 29.5%, for EPS of ¥80.85.
Set the nine-month actuals against those targets and the arithmetic is striking. Operating profit of ¥67,449 million already represents 87.6% of the ¥77,000 million full-year figure, leaving roughly ¥9.6 billion for the fourth quarter — against an average of about ¥22.5 billion per quarter across the first nine months. Profit attributable to owners of ¥36,035 million is 87.9% of the ¥41,000 million target, implying about ¥5.0 billion in the fourth quarter versus a nine-month quarterly average near ¥12.0 billion. Net sales are the exception: the ¥709,272 million booked is 74.7% of the ¥950,000 million target, implying a fourth quarter of roughly ¥240.7 billion — broadly in line with the run rate. The shape the guidance describes, then, is a quarter in which revenue holds but profit falls away by more than half. The release does not explain why, and this article will not speculate beyond noting what the numbers imply.
The dividend forecast was also revised, and upward. The company now guides to a full-year dividend of ¥20.00 per share for FY9/2026 — nil at the interim, ¥20.00 at the year-end — against ¥17.00 paid for FY9/2025 on the same nil-interim pattern, an increase of 17.6%. That payout implies a ratio of roughly a quarter of guided EPS.
Finally, the housekeeping. There was no significant change to the scope of consolidation, no application of special accounting treatments for quarterly statements, and no changes in accounting policies, accounting estimates or restatements. Impairment losses for the nine months totalled ¥1,318 million, split ¥383 million in Media & IP, ¥214 million in Internet Advertising, ¥720 million in Game and nil against corporate assets, arising from reduced profitability and the discontinuation of certain services — well below the ¥3,892 million recognised a year earlier, when the Game segment alone accounted for ¥3,514 million. Supplementary materials were prepared and an earnings briefing was held by video distribution only. Readers should also note that the attached quarterly consolidated financial statements are not subject to review by a certified public accountant or an audit firm.
| Metric | 9M FY9/2026 | 9M FY9/2025 | Change |
|---|---|---|---|
| Net sales (¥ million) | 709,272 | 631,993 | +12.2% |
| Operating profit (¥ million) | 67,449 | 48,798 | +38.2% |
| Ordinary profit (¥ million) | 69,182 | 48,631 | +42.3% |
| Profit attrib. to owners of parent (¥ million) | 36,035 | 24,103 | +49.5% |
| Comprehensive income (¥ million) | 42,422 | 30,775 | +37.8% |
| Basic EPS (¥) | 71.07 | 47.59 | +49.3% |
| Diluted EPS (¥) | 67.10 | 44.88 | +49.5% |
| Media & IP revenue (¥ million) | 183,931 | 168,913 | +8.9% |
| Media & IP segment profit (¥ million) | 13,178 | 7,008 | +88.0% |
| Internet Advertising revenue (¥ million) | 363,687 | 346,748 | +4.9% |
| Internet Advertising segment profit (¥ million) | 15,425 | 15,697 | −1.7% |
| Game revenue (¥ million) | 193,391 | 140,364 | +37.8% |
| Game segment profit (¥ million) | 50,923 | 35,162 | +44.8% |
| Investment Development revenue (¥ million) | 243 | 1,435 | −83.0% |
| Investment Development segment profit (¥ million) | −1,648 | −860 | loss widened |
| Total assets (¥ million; vs Sep 30, 2025) | 551,172 | 557,162 | −1.1% |
| Net assets (¥ million; vs Sep 30, 2025) | 297,897 | 275,681 | +8.1% |
| Equity ratio (vs Sep 30, 2025) | 37.2% | 32.3% | +4.9 pt |
| Full-year dividend forecast (¥) | 20.00 | 17.00 | +17.6% |
JapanStockPulse provides informational content only and does not constitute investment advice. Figures are taken from the company's published earnings short report and may be subject to subsequent revision.