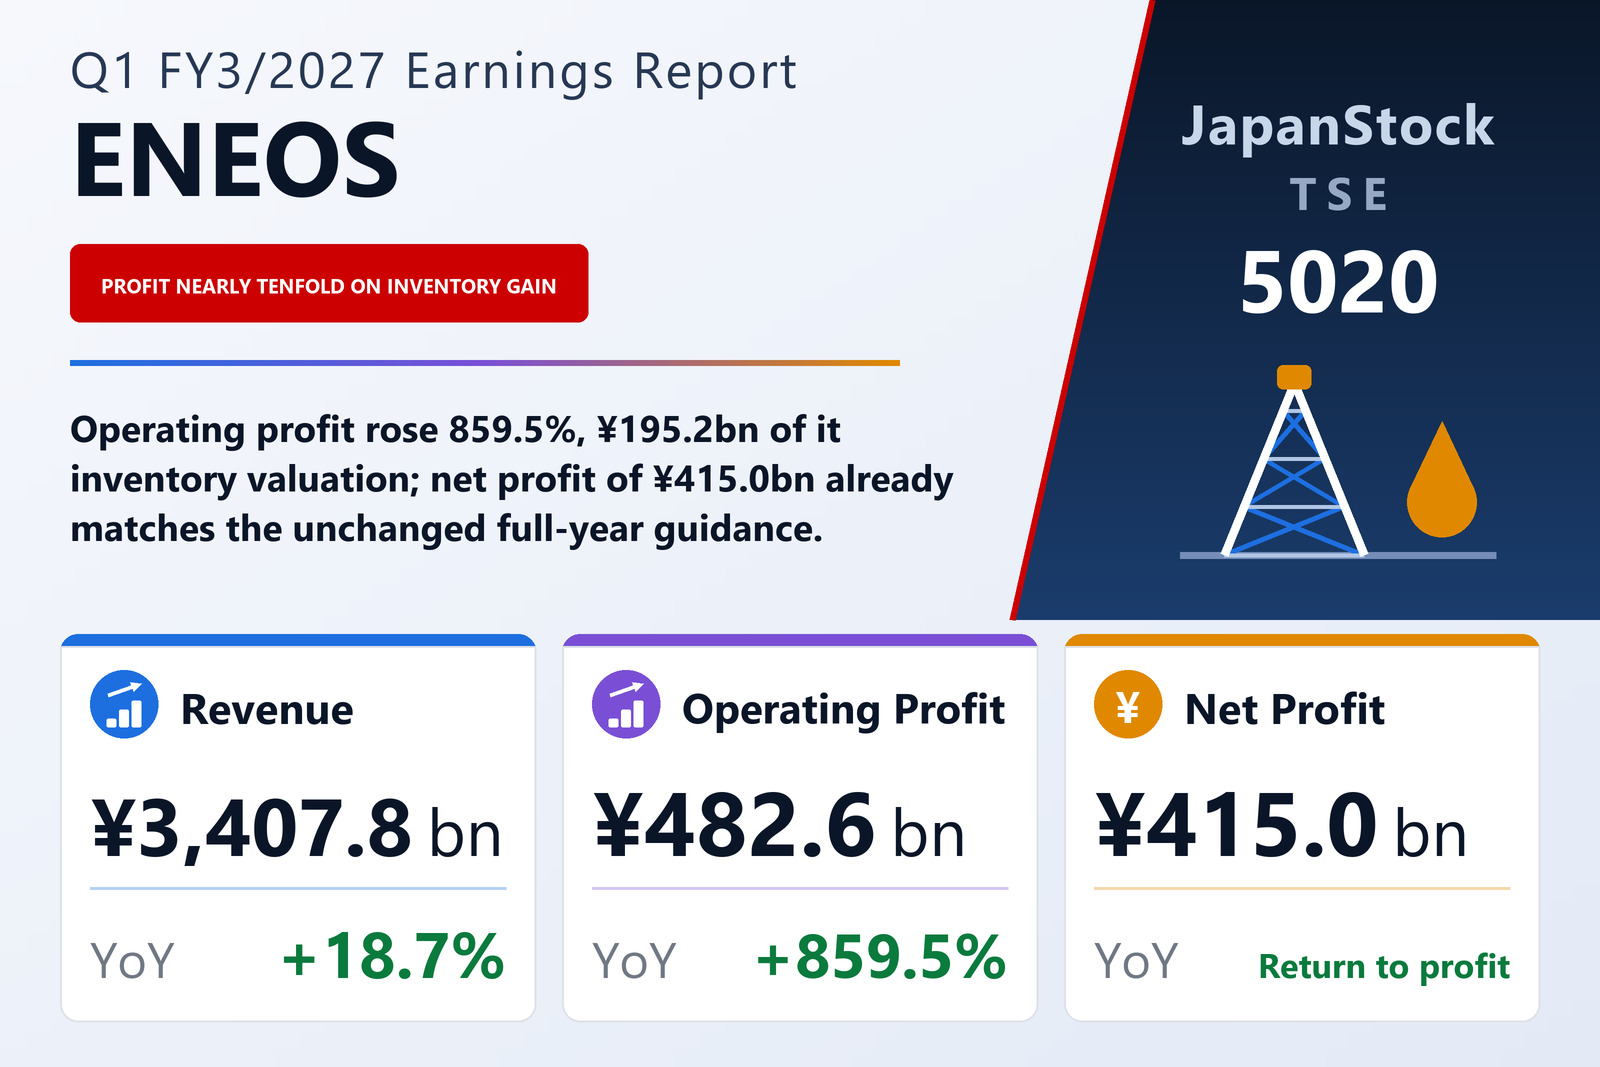
Operating profit rose 859.5% — and most of the jump was inventory valuation
ENEOS Holdings, Inc. (TSE: 5020), the energy group whose reporting segments run from oil refining and marketing through oil and gas development, functional materials, electricity and renewable energy, published consolidated results for the first quarter of FY3/2027 — the three months from April 1 to June 30, 2026 — on August 7, 2026 under IFRS. Revenue rose 18.7% to ¥3,407,831 million, operating profit 859.5% to ¥482,596 million and profit before tax 976.0% to ¥477,659 million, while profit attributable to owners of the parent was ¥414,981 million against a loss of ¥14,516 million a year earlier, for basic earnings of ¥154.64 per share against a loss of ¥5.40. The shares are listed on the Tokyo and Nagoya stock exchanges.
The quarter's arithmetic is unusually lopsided. Revenue grew by ¥537,857 million, but cost of sales rose only 3.0% to ¥2,762,390 million, so gross profit more than tripled, from ¥187,305 million to ¥645,441 million, and the gross margin widened from 6.5% to 18.9%. Selling, general and administrative expenses grew just 3.3% to ¥223,360 million. Two smaller lines moved in opposite directions: equity-method investment income rose from ¥7,261 million to ¥35,468 million, while other income fell from ¥81,136 million to ¥34,749 million — the prior-year quarter's cash-flow statement shows a ¥63,373 million gain on the sale of subsidiary shares. The operating margin moved from 1.8% to 14.2%.
Strip out inventory valuation and operating profit roughly doubled
ENEOS reports how much of each result comes from the valuation of inventories under the weighted-average method and write-downs, as it flows through cost of sales. Excluding that inventory effect, operating profit was ¥287.4 billion, up ¥152.3 billion, roughly double the implied ¥135.1 billion of a year earlier. The filing books the effect in the Petroleum Products and Other segment, where it swung from a loss of ¥84.8 billion to a gain of ¥195.2 billion. Of the ¥432.3 billion increase in reported operating profit, therefore, about ¥280.0 billion was the swing in inventory valuation and ¥152.3 billion was the underlying business.
The market backdrop was violent. Dubai crude opened the quarter at $109 a barrel, rose to $120 as tensions in the Middle East escalated, then fell to $68 by the end of June on hopes of a peace agreement between the United States and Iran and expectations that shipping through the Strait of Hormuz would normalise — ending $41 below where it began. The period average was $96, up $29 year on year. The yen weakened against the dollar from ¥159 to ¥162 over the quarter, on Middle East tensions and the Japan–US interest-rate gap, and averaged ¥159, 14 yen weaker than a year earlier.
Petroleum products: lower volumes, far higher profit
Petroleum Products and Other, by far the largest segment, lifted revenue 21.4% to ¥3,057,383 million and operating profit from ¥1,649 million to ¥406,617 million, an increase of ¥405.0 billion that includes the ¥195.2 billion inventory gain; excluding it, segment profit was ¥211.4 billion, up ¥125.0 billion. That came despite lower volumes: petroleum product sales volume fell 9.6%, which the company attributes to the structural decline in domestic demand, mainly from better vehicle fuel efficiency, and to lower exports as it gave priority to stable domestic supply. Its petrochemical margins improved for both paraxylene and benzene, as raw-material shortages linked to the Middle East and reduced operating rates at regional plants tightened supply and demand.
The filing is candid that the Middle East also complicated sourcing. Uncertainty over crude supply has affected the company's procurement, and to keep products flowing it has drawn on national stockpiles, diversified its suppliers and made emergency purchases of crude and products in the market. It adds that international crude and product prices and procurement-related costs are affecting its business environment, but it does not quantify those costs.
Upstream and functional materials grew; electricity fell
From April 1, 2026 the group moved the natural-gas liquefaction and domestic gas sales businesses of ENEOS Corporation into ENEOS Xplora, which runs oil and gas development and production, so that one company manages the gas chain from field development to sales; prior-year segment figures have been restated on the new basis. Oil and Natural Gas E&P revenue rose 14.0% to ¥87,389 million and operating profit rose ¥11.6 billion to ¥27,055 million. Crude output fell because a Middle East project stopped producing when the Strait of Hormuz was closed, while gas output rose as the prior year's scheduled maintenance at the SK10 block offshore Sarawak, Malaysia, did not recur. Crude selling prices rose with the market; gas prices were roughly flat.
Functional Materials sold lower volumes because of scheduled maintenance and Middle East effects on some products, yet revenue rose 18.8% to ¥100,464 million and operating profit rose ¥6.4 billion to ¥11,732 million, helped by soaring butadiene prices and the weak yen. Electricity went the other way: revenue fell 23.5% to ¥58,820 million and operating profit dropped ¥5.3 billion to ¥2,722 million, on lower retail volumes and a temporary rise in power-procurement costs from the end of an interconnection-line scheme and a shift in the timing of cost recognition. Renewable Energy revenue rose 0.8% to ¥12,242 million, with operating profit of ¥313 million against ¥251 million; new solar plants added output, but poor weather kept results roughly level.
Businesses outside the reportable segments, chiefly construction and metals, posted revenue down 8.4% to ¥114,214 million but operating profit up ¥14.4 billion to ¥35,181 million. In metals, higher metal prices and AI-related demand kept semiconductor and telecom-materials markets at high levels, and the group sold part of its shares in SCM Minera Lumina Copper Chile in April 2026; construction faced higher raw-material costs and a tight labour market. Segment revenues include ¥22.7 billion of intersegment sales, against ¥23.9 billion a year earlier.
Below the operating line: a light tax charge and a return to profit
Net finance costs were ¥4,937 million (finance income of ¥3,603 million against finance costs of ¥8,540 million), leaving profit before tax of ¥477,659 million. Income tax expense was ¥48,857 million, only ¥9,794 million more than a year earlier on a pre-tax profit more than ten times larger — an effective rate of about 10.2% against roughly 88% in the prior-year quarter. The filing does not explain the low charge. Quarterly profit was ¥428,802 million against ¥5,330 million; ¥13,821 million went to non-controlling interests, leaving ¥414,981 million for owners of the parent, and diluted EPS was ¥154.35. Comprehensive income was ¥467,088 million against a loss of ¥39,593 million, helped by ¥17,243 million of foreign-currency translation differences and ¥21,592 million of cash-flow hedges.
Inventories absorbed the cash
Total assets rose 5.8% to ¥9,625,870 million from March 31, 2026, driven by inventories, which climbed from ¥1,557,786 million to ¥2,136,607 million, while cash and cash equivalents fell from ¥877,295 million to ¥470,133 million. Total equity rose 10.0% to ¥4,132,462 million and equity attributable to owners of the parent 11.2% to ¥3,747,189 million, lifting the ratio of parent equity to assets from 37.1% to 38.9%. Interest-bearing debt including leases fell ¥227.8 billion to ¥2,387.9 billion, but net of cash it rose ¥179.2 billion to ¥1,883.0 billion; the net debt-to-equity ratio improved by 0.01 point to 0.50 times before the hybrid-bond equity adjustment.
Operating cash flow fell 67.9% to ¥58,559 million: a ¥575,537 million increase in inventories consumed most of what pre-tax profit and a ¥253,809 million rise in trade payables generated. Investing activities used ¥139,103 million, including ¥91,016 million of capital expenditure and ¥67,178 million of investment securities, against ¥33,436 million a year earlier. Financing used ¥338,769 million: ¥158,781 million went to repaying long-term loans and redeeming bonds, ¥66,740 million to cutting short-term borrowings, ¥45,803 million to dividends and ¥31,175 million to share buybacks, which took treasury shares from 16,873,857 to 41,752,519. Cash fell ¥407.2 billion over the quarter.
Guidance held — though first-quarter net profit already equals the full-year figure
ENEOS left its full-year FY3/2027 guidance, first published on May 14, unchanged: revenue of ¥12,850,000 million (+9.2%), operating profit of ¥610,000 million (+30.7%), profit before tax of ¥590,000 million (+31.5%) and profit attributable to owners of the parent of ¥415,000 million (+60.4%), or ¥155.72 per share. Operating profit excluding inventory effects is guided at ¥590,000 million, up 24.4% from ¥474,454 million. Against those targets the first quarter delivered 26.5% of guided revenue, 79.1% of guided operating profit and, in effect, all of guided net profit — ¥414,981 million against ¥415,000 million — while inventory-excluded operating profit of ¥287.4 billion is 48.7% of its target. Holding the forecast therefore implies next to no net profit over the remaining nine months. The filing gives no reason for keeping it and does not state the crude-price or exchange-rate assumptions behind it.
Two items already in train will affect the rest of the year. ENEOS tendered 57,300,022 shares of JX Advanced Metals into that company's own share buyback, which closed on June 17; 57,274,900 shares were accepted, settlement was completed on July 9, and the shares were reclassified as assets held for sale, which stood at ¥115,109 million at June 30. The company expects to book about ¥83.3 billion of other income from the transaction in the first half. On August 7 its board also approved the acquisition of TPC Holdings, Inc. of the United States through a wholly owned US subsidiary, by merging a special-purpose company with TPC; completion is expected in October 2026, subject to regulatory approvals. The dividend forecast is unchanged at ¥17.00 at the half and ¥17.00 at the year-end, for ¥34.00, the same as FY3/2026.
| Metric | Q1 FY3/2027 | Q1 FY3/2026 | Change |
|---|---|---|---|
| Revenue (¥ million) | 3,407,831 | 2,869,974 | +18.7% |
| Gross profit (¥ million) | 645,441 | 187,305 | +244.6% |
| Gross margin | 18.9% | 6.5% | +12.4 pt |
| SG&A expenses (¥ million) | 223,360 | 216,317 | +3.3% |
| Operating profit (¥ million) | 482,596 | 50,299 | +859.5% |
| Operating margin | 14.2% | 1.8% | +12.4 pt |
| Pre-tax profit (¥ million) | 477,659 | 44,393 | +976.0% |
| Net profit attrib. to owners of parent (¥ million) | 414,981 | −14,516 | loss to profit |
| EPS (¥) | 154.64 | −5.40 | loss to profit |
| Petroleum Products and Other — revenue (¥ million) | 3,057,383 | 2,518,859 | +21.4% |
| Petroleum Products and Other — segment profit (¥ million) | 406,617 | 1,649 | n.m. |
| Oil and Natural Gas E&P — revenue (¥ million) | 87,389 | 76,711 | +14.0% |
| Oil and Natural Gas E&P — segment profit (¥ million) | 27,055 | 15,497 | +74.6% |
| Functional Materials — revenue (¥ million) | 100,464 | 84,642 | +18.8% |
| Functional Materials — segment profit (¥ million) | 11,732 | 5,318 | +120.6% |
| Electricity — revenue (¥ million) | 58,820 | 76,920 | −23.5% |
| Electricity — segment profit (¥ million) | 2,722 | 8,044 | −66.2% |
| Renewable Energy — revenue (¥ million) | 12,242 | 12,077 | +0.8% |
| Renewable Energy — segment profit (¥ million) | 313 | 251 | +24.7% |
| Other — revenue (¥ million) | 114,214 | 124,704 | −8.4% |
| Other — segment profit (¥ million) | 35,181 | 20,846 | +68.8% |
| Operating cash flow (¥ million) | 58,559 | 182,434 | −67.9% |
| Total assets (¥ million) | 9,625,870 | 9,094,314 | +5.8% |
| Net assets (¥ million) | 4,132,462 | 3,758,201 | +10.0% |
| Equity attrib. to owners of parent (¥ million) | 3,747,189 | 3,369,775 | +11.2% |
| Equity ratio | 38.9% | 37.1% | +1.8 pt |
| FY3/2027 guidance — revenue (¥ million) | 12,850,000 | — | +9.2% |
| FY3/2027 guidance — operating profit (¥ million) | 610,000 | — | +30.7% |
| FY3/2027 guidance — pre-tax profit (¥ million) | 590,000 | — | +31.5% |
| FY3/2027 guidance — net profit attrib. to owners of parent (¥ million) | 415,000 | — | +60.4% |
| FY3/2027 guidance — EPS (¥) | 155.72 | — | — |
| Annual dividend per share (¥) | 34.00 | 34.00 | unchanged |
JapanStockPulse provides informational content only and does not constitute investment advice. Figures are taken from the company's published earnings short report and may be subject to subsequent revision.