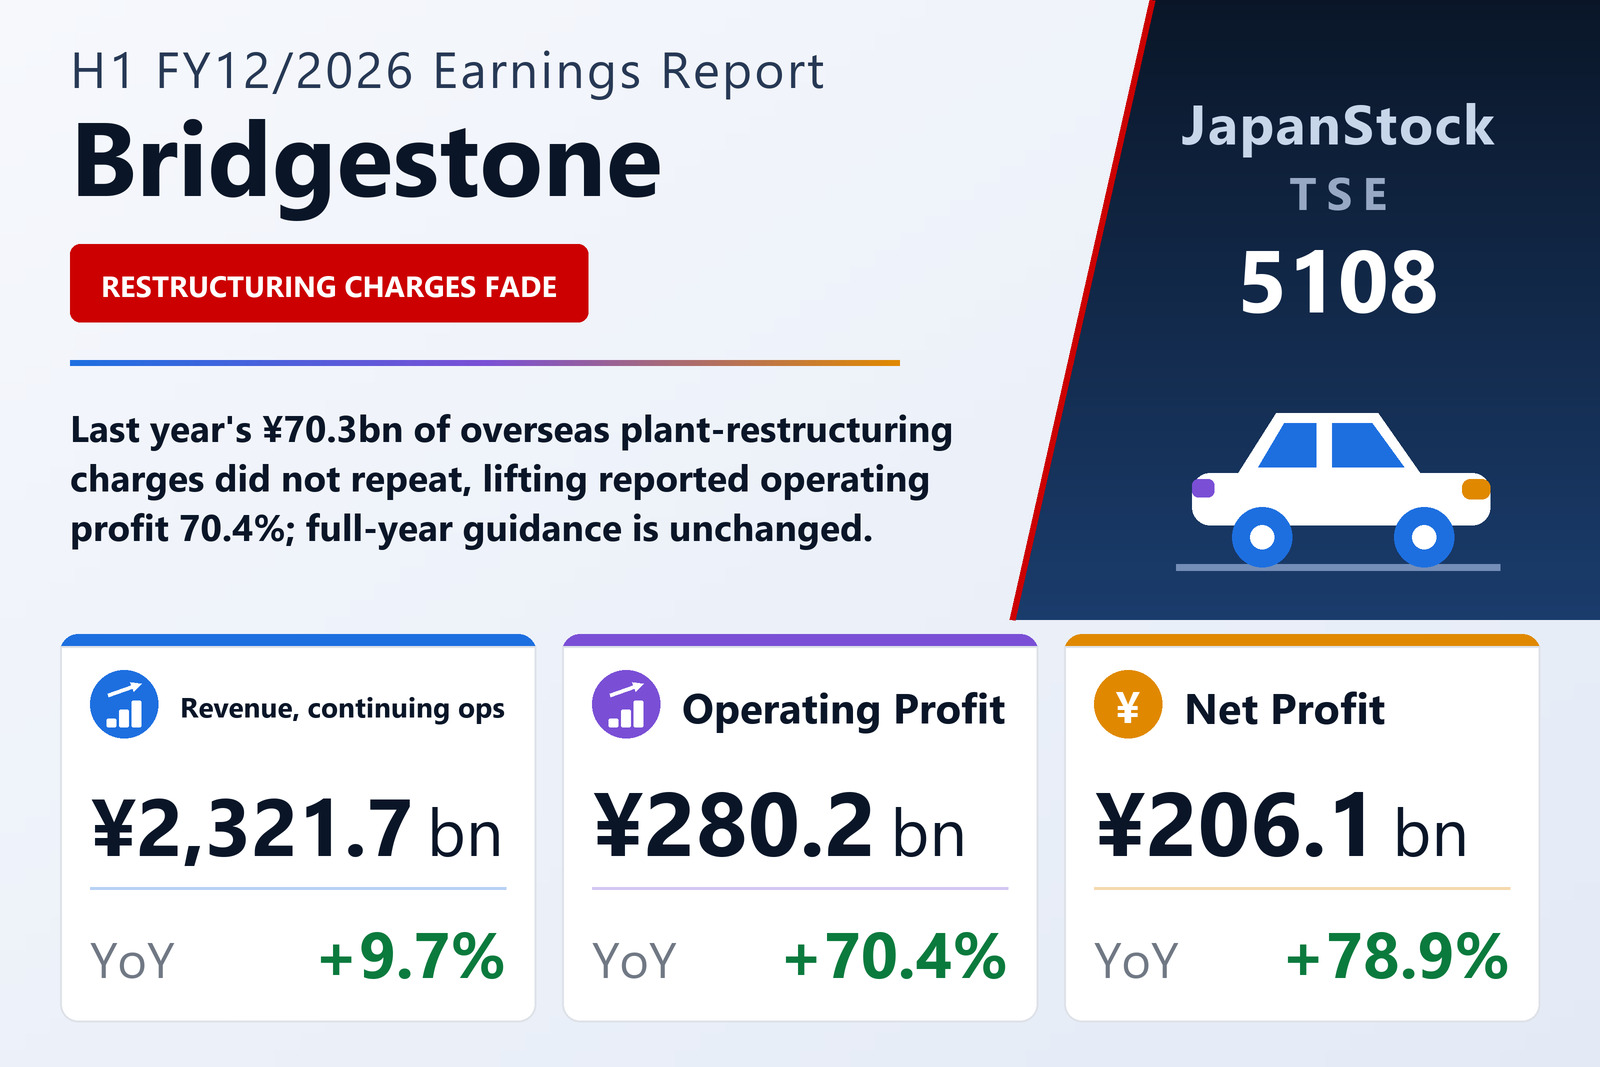
Bridgestone Corporation (TSE: 5108), the world's largest tyre manufacturer by revenue, reported interim results for the six months to June 30, 2026 under IFRS. Revenue from continuing operations rose 9.7% to ¥2,321,667 million. Adjusted operating profit — the company's own non-IFRS measure, which removes designated one-off gains and charges from reported operating profit — climbed 19.7% to ¥280,871 million, while reported operating profit surged 70.4% to ¥280,229 million. Profit attributable to owners of the parent, including discontinued operations, jumped 78.5% to ¥206,245 million, and basic earnings per share reached ¥163.30, up from ¥85.11.
Why reported profit outran the adjusted measure
The gap between a 19.7% rise in adjusted operating profit and a 70.4% rise in the reported figure is almost entirely a base effect. The first half of 2025 absorbed ¥71,825 million of adjustment charges, of which ¥70,271 million related to the restructuring of overseas tyre plants in the Americas and Europe. This year the equivalent charge was only ¥11,790 million, with ¥11,093 million tied to plant restructuring in Asia-Pacific and to the group's in-house materials operations. Adjustment gains moved the other way, rising to ¥11,148 million from ¥1,665 million — including ¥10,656 million of restructuring-related income. Net of both sides, adjustments were roughly neutral this year against a drag of more than ¥70 billion a year earlier.
Margins widened across the cost line
Gross profit rose 13.1% to ¥922,732 million, lifting the gross margin to 39.7% from 38.6%. Selling, general and administrative expenses increased 9.6% to ¥642,616 million but held steady at 27.7% of revenue — distribution and freight costs were ¥114,256 million, advertising and sales promotion ¥48,797 million, employee benefits ¥191,480 million, depreciation and amortisation ¥68,839 million, and research and development ¥61,296 million. The adjusted operating margin improved to 12.1% from 11.1%. Below the operating line, finance income of ¥11,552 million and finance costs of ¥17,813 million left profit before tax up 76.7% at ¥274,603 million, on an effective tax rate of 23.5%.
Anti-vibration rubber still sits outside the numbers
All of the above excludes the anti-vibration rubber business, which remains classified as a discontinued operation following the 2022 sale of Prospira Co., Ltd. to Anhui Zhongding Holding (Group); a handful of subsidiaries are still to transfer individually. The unit contributed revenue of ¥3,309 million and profit of just ¥161 million, against ¥334 million a year earlier. On a continuing-operations basis alone, profit attributable to owners of the parent was ¥206,083 million, up 78.9%.
A ¥372 billion swing in comprehensive income
The most dramatic line in the statements is comprehensive income, which came in at ¥305,724 million against a loss of ¥66,435 million a year earlier. The swing is currency: foreign-currency translation of overseas operations added ¥92,853 million this half after subtracting ¥181,467 million in the prior-year period, taking total other comprehensive income to a positive ¥95,400 million from negative ¥185,538 million.
Buybacks, a share cancellation and a stronger balance sheet
Total assets grew to ¥5,902,954 million from ¥5,747,705 million at the end of December 2025, with cash and equivalents up to ¥791,733 million from ¥713,810 million and inventories at ¥935,234 million. Non-current bonds and borrowings rose to ¥481,739 million from ¥392,312 million. Equity attributable to owners of the parent reached ¥3,781,546 million and the equity ratio firmed to 64.1% from 63.7% — despite ¥109,291 million of share buybacks and ¥73,402 million of dividends paid during the half. Bridgestone also cancelled ¥268,586 million of treasury stock, cutting shares issued to 1,334,037,042 from 1,427,396,442 and treasury holdings to 89,390,759 from 150,838,696.
Full-year guidance left untouched
Management made no change to its full-year forecast: continuing-operations revenue of ¥4,500,000 million (+1.6%), adjusted operating profit of ¥515,000 million (+4.3%), profit attributable to owners of the parent of ¥340,000 million (+3.9%) and EPS of ¥270.87. The first half already delivered 51.6% of the revenue target, 54.5% of the adjusted-operating-profit target and 60.7% of the profit target, implying second-half revenue of roughly ¥2.18 trillion — below the ¥2.32 trillion booked in the first six months.
Interim dividend of ¥60 after the two-for-one split
The board declared an interim dividend of ¥60.00 per share, payable from September 1, 2026, and kept its year-end forecast at ¥65.00 for an annual total of ¥125.00 — unchanged from the previously announced forecast. The comparison with FY12/2025's ¥230.00 annual dividend is distorted by the one-for-two stock split effective January 1, 2026; restated on the post-split basis, last year's payout equates to ¥115.00, so the guided total represents an increase of 8.7%. At the guided EPS of ¥270.87 the payout ratio is about 46%.
| Metric | H1 FY12/2026 | H1 FY12/2025 | YoY |
|---|---|---|---|
| Revenue, continuing ops (¥ billion) | 2,321.67 | 2,116.44 | +9.7% |
| Adjusted operating profit (¥ billion) | 280.87 | 234.64 | +19.7% |
| Operating profit (¥ billion) | 280.23 | 164.48 | +70.4% |
| Profit before tax (¥ billion) | 274.60 | 155.41 | +76.7% |
| Profit attrib. to owners, continuing ops (¥ billion) | 206.08 | 115.19 | +78.9% |
| Profit attrib. to owners, incl. discontinued (¥ billion) | 206.25 | 115.52 | +78.5% |
| Comprehensive income (¥ billion) | 305.72 | -66.44 | n.m. |
| Basic EPS (¥) | 163.30 | 85.11 | +91.9% |
| Interim dividend per share (¥; FY25 pre-split) | 60.00 | 115.00 | — |
| FY12/2026 revenue guidance (¥ billion) | 4,500.00 | — | +1.6% |
| FY12/2026 adjusted operating profit guidance (¥ billion) | 515.00 | — | +4.3% |
| FY12/2026 net profit guidance (¥ billion) | 340.00 | — | +3.9% |
JapanStockPulse provides informational content only and does not constitute investment advice. Figures are taken from the company's published earnings short report and may be subject to subsequent revision.