Modest revenue growth, dramatic profit growth
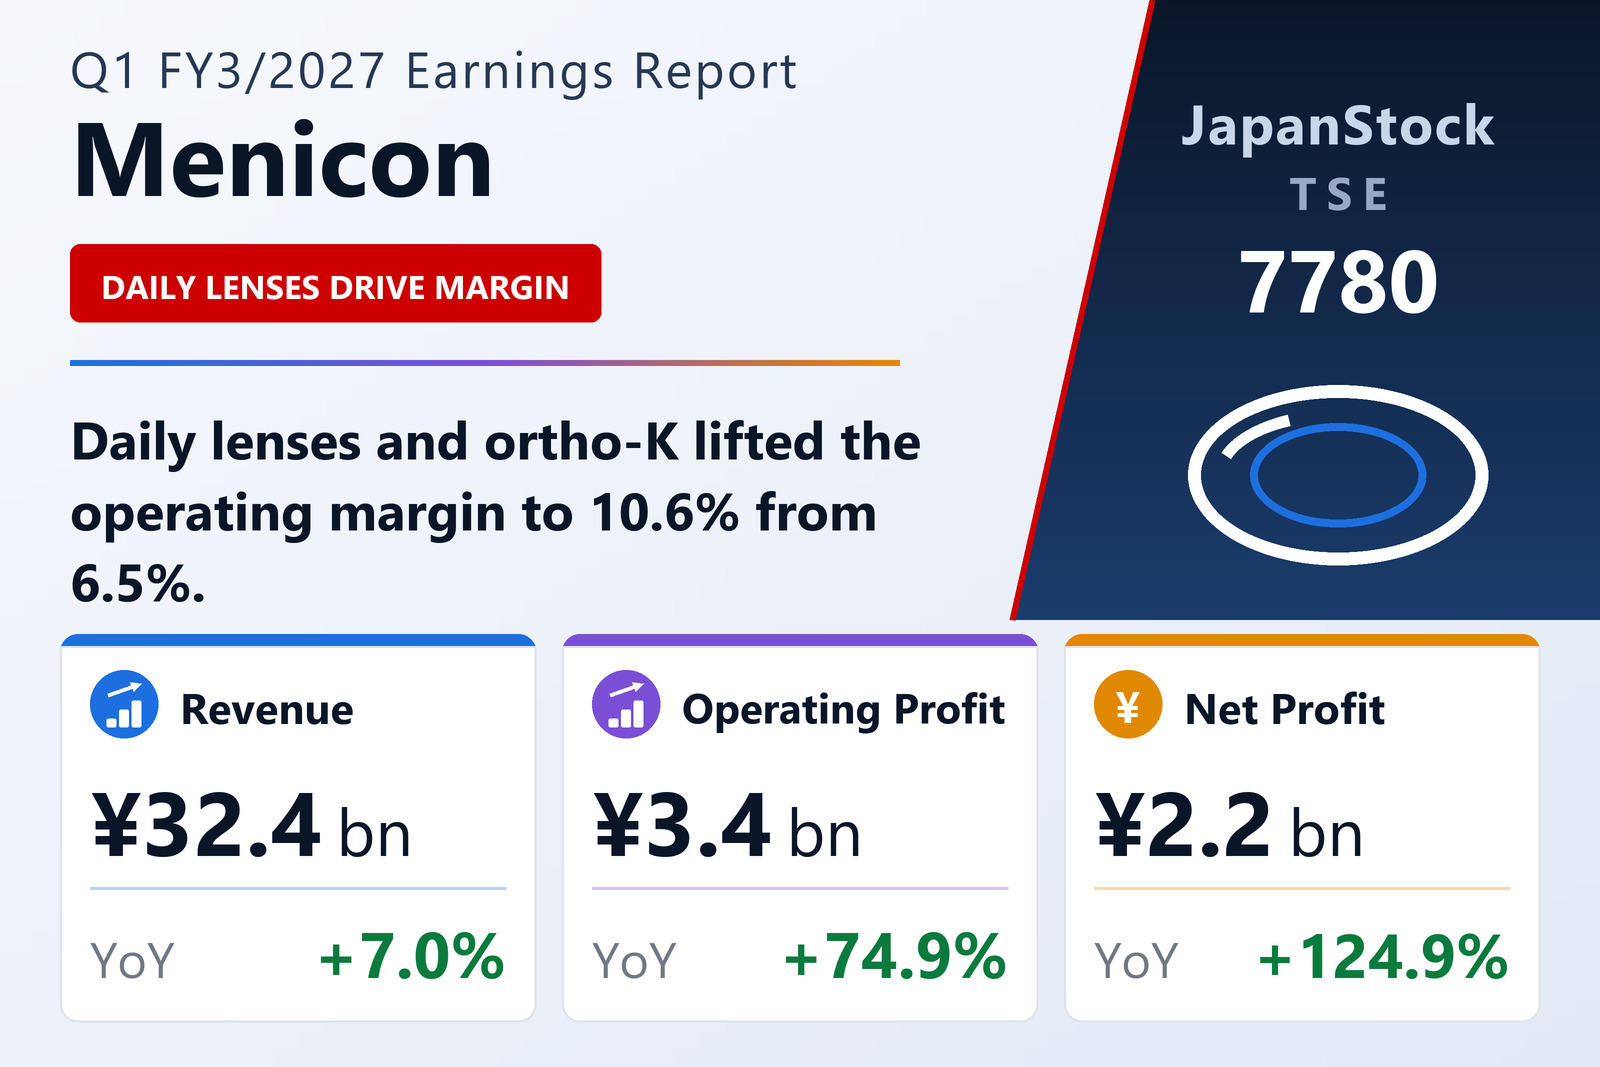
Menicon Co., Ltd. (TSE: 7780), listed on both the Tokyo and Nagoya exchanges, published consolidated results for the three months to June 30, 2026 on August 7, 2026 under Japanese GAAP. Net sales rose 7.0% to ¥32,376 million, but operating profit rose 74.9% to ¥3,429 million — the operating margin widening to 10.6% from 6.5%. Ordinary profit rose 90.1% to ¥3,361 million and net profit attributable to owners of the parent 124.9% to ¥2,230 million, for earnings per share of ¥30.05 against ¥13.05.
The step from operating to ordinary profit is currency: the prior year carried a foreign-exchange loss and this year a foreign-exchange gain, which is why the ordinary line grew faster than the operating line. That reversal is not operational and will not necessarily repeat.
Vision Care: two products doing the work
Vision Care — 93% of group sales — lifted revenue 7.1% to ¥30,211 million and segment profit 42.7% to ¥5,187 million. Two product lines account for most of the increase: daily disposable lenses added ¥1,113 million of revenue and orthokeratology lenses ¥486 million. Together that is roughly ¥1.6 billion of the segment's ¥2.0 billion gain.
The named products are the Melsplan membership programme, the Alpha Ortho-K and Menicon Ortho-K ranges, Menicon Z Night and Menicon Bloom Night. Orthokeratology — overnight lenses that reshape the cornea, used in Japan and elsewhere partly for myopia control in children — is the smaller of the two contributors but the faster-growing, and it is where Menicon's technical position is most distinct.
The Other segment, which includes the group's non-lens businesses, grew revenue 6.5% to ¥2,165 million but widened its loss to ¥146 million from ¥102 million.
Plant, acquisition, disposal
Three structural moves were disclosed. Menicon Malaysia Sdn. Bhd. was established as a new production base. Inter Optical Co., Ltd. was acquired and consolidated. And Menicon (Shanghai) Pet Health Care left the scope of consolidation. The first two add capacity and distribution in vision care; the third trims a non-core venture.
Balance sheet and guidance
Total assets rose 4.5% from the March year-end to ¥203,359 million while net assets rose only 1.2% to ¥96,246 million, so the equity ratio slipped to 47.0% from 48.5% — the balance sheet growing faster than equity, consistent with the new plant and the acquisition.
Guidance for FY3/2027 is unchanged: net sales of ¥133,000 million (+5.9%), operating profit of ¥11,000 million (+7.5%), ordinary profit of ¥10,500 million (−4.7%) and net profit of ¥6,500 million (+9.9%), for earnings per share of ¥87.52. Note that ordinary profit is forecast to fall while operating profit rises — the company is not assuming the currency gain repeats. The quarter has already delivered 31.2% of the full-year operating-profit target. The annual dividend forecast is unchanged at ¥28.00 per share, split ¥14.00 interim and ¥14.00 year-end.
| Metric | Q1 FY3/2027 | Q1 FY3/2026 | Change |
|---|---|---|---|
| Net sales (¥ million) | 32,376 | 30,251 | +7.0% |
| Operating profit (¥ million) | 3,429 | 1,961 | +74.9% |
| Operating margin | 10.6% | 6.5% | +4.1 pt |
| Ordinary profit (¥ million) | 3,361 | 1,768 | +90.1% |
| Net profit attrib. to owners of parent (¥ million) | 2,230 | 991 | +124.9% |
| Comprehensive income (¥ million) | 3,182 | 1,134 | +180.6% |
| EPS (¥) | 30.05 | 13.05 | +130.3% |
| Vision Care — revenue (¥ million) | 30,211 | 28,217 | +7.1% |
| Vision Care — segment profit (¥ million) | 5,187 | 3,636 | +42.7% |
| Other — revenue (¥ million) | 2,165 | 2,034 | +6.5% |
| Other — segment profit (¥ million) | −146 | −102 | loss widened |
| Total assets (¥ million) | 203,359 | 194,640 | +4.5% |
| Net assets (¥ million) | 96,246 | 95,106 | +1.2% |
| Equity ratio | 47.0% | 48.5% | −1.5 pt |
| FY3/2027 guidance — revenue (¥ million) | 133,000 | — | +5.9% |
| FY3/2027 guidance — operating profit (¥ million) | 11,000 | — | +7.5% |
| FY3/2027 guidance — ordinary profit (¥ million) | 10,500 | — | −4.7% |
| FY3/2027 guidance — net profit (¥ million) | 6,500 | — | +9.9% |
| FY3/2027 guidance — EPS (¥) | 87.52 | — | n.m. |
| Annual dividend per share (¥) | 28.00 | 28.00 | unchanged |
JapanStockPulse provides informational content only and does not constitute investment advice. Figures are taken from the company's published earnings short report and may be subject to subsequent revision.