Records at every line
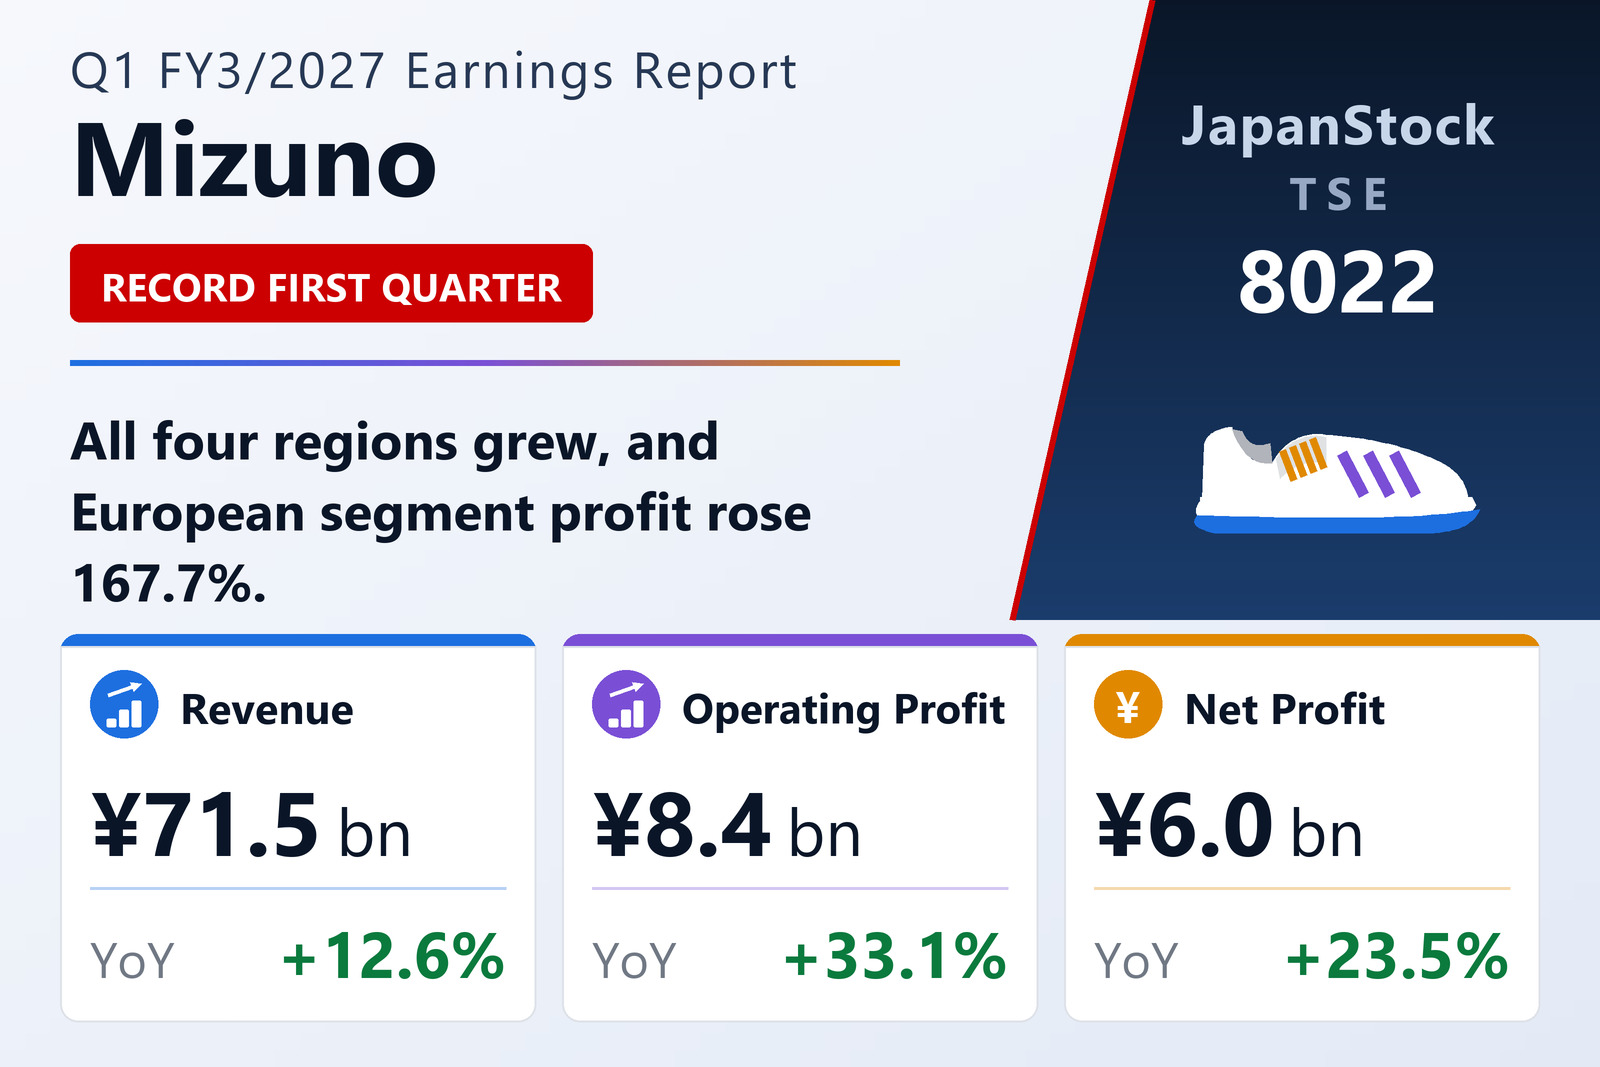
Mizuno Corporation (TSE: 8022) published consolidated results for the three months to June 30, 2026 on August 7, 2026 under Japanese GAAP. Net sales rose 12.6% to ¥71,505 million, operating profit 33.1% to ¥8,360 million, ordinary profit 28.2% to ¥8,671 million and net profit attributable to owners of the parent 23.5% to ¥6,028 million. The company records all four as first-quarter highs. Earnings per share were ¥79.28 against ¥63.60.
The operating margin widened to 11.7% from 9.9% — profit growing at more than twice the rate of sales, which is the quarter's defining feature. Comprehensive income was ¥7,411 million against ¥2,269 million, the gap reflecting currency translation on an increasingly overseas-weighted business.
Europe is the standout, but every region grew
Europe lifted revenue 24.0% to ¥9,877 million and segment profit 167.7% to ¥1,040 million — from a low base, but the largest single contribution to the group's margin expansion. Asia and Oceania grew revenue fastest after Europe, up 17.3% to ¥10,492 million, though segment profit slipped 1.2% to ¥1,087 million, held back by a stalling Korean golf market.
The Americas lifted revenue 15.8% to ¥13,749 million and profit 8.4% to ¥1,851 million, while Japan — still over half the group at ¥37,386 million — grew revenue 7.6% and profit 34.6% to ¥4,102 million. Japan is the slowest-growing region on revenue and among the fastest on profit, which is a mix story rather than a volume one.
What sold
The company names football, golf and sports-style footwear as the drivers, alongside its workwear business. In golf, the newly launched "JPX ONE" club series contributed. Sports-style shoes continued to sell well across regions. The one soft spot named is the Korean golf market, where demand stalled — the reason Asia and Oceania grew revenue 17.3% while its profit went slightly backwards.
Currency was a tailwind on translation. Average rates were ¥211.06 to the pound (¥193.10 a year earlier), ¥183.71 to the euro (¥160.71) and ¥156.44 to the dollar (¥152.94) — a weaker yen against all three, and against the euro by more than 14%. Part of the 24.0% European revenue growth is that, rather than volume.
Balance sheet and guidance
Total assets edged down 0.5% from the March year-end to ¥250,294 million while net assets rose 2.8% to ¥179,186 million, lifting the equity ratio to 71.2% from 68.9%. MIZUNO APAC (VIETNAM) COMPANY LIMITED was newly included in the scope of consolidation during the quarter.
Guidance for FY3/2027, set on May 12, 2026, is unchanged: net sales of ¥280,000 million (+8.1%), operating profit of ¥25,500 million (+12.8%), ordinary profit of ¥26,500 million (+10.5%) and net profit of ¥19,000 million (+3.4%), for earnings per share of ¥249.86. The quarter delivered 32.8% of the full-year operating-profit target in the first three months of twelve — a pace that leaves the unchanged guidance looking conservative, though sporting-goods demand is seasonal and the company has left it alone. The annual dividend forecast rises to ¥66.00 per share from ¥60.00, split ¥33.00 interim and ¥33.00 year-end.
| Metric | Q1 FY3/2027 | Q1 FY3/2026 | Change |
|---|---|---|---|
| Net sales (¥ million) | 71,505 | 63,528 | +12.6% |
| Operating profit (¥ million) | 8,360 | 6,281 | +33.1% |
| Operating margin | 11.7% | 9.9% | +1.8 pt |
| Ordinary profit (¥ million) | 8,671 | 6,762 | +28.2% |
| Net profit attrib. to owners of parent (¥ million) | 6,028 | 4,880 | +23.5% |
| Comprehensive income (¥ million) | 7,411 | 2,269 | +226.6% |
| EPS (¥) | 79.28 | 63.60 | +24.7% |
| Japan — revenue (¥ million) | 37,386 | 34,743 | +7.6% |
| Japan — segment profit (¥ million) | 4,102 | 3,048 | +34.6% |
| Europe — revenue (¥ million) | 9,877 | 7,966 | +24.0% |
| Europe — segment profit (¥ million) | 1,040 | 388 | +167.7% |
| Americas — revenue (¥ million) | 13,749 | 11,874 | +15.8% |
| Americas — segment profit (¥ million) | 1,851 | 1,708 | +8.4% |
| Asia and Oceania — revenue (¥ million) | 10,492 | 8,946 | +17.3% |
| Asia and Oceania — segment profit (¥ million) | 1,087 | 1,100 | −1.2% |
| Total assets (¥ million) | 250,294 | 251,471 | −0.5% |
| Net assets (¥ million) | 179,186 | 174,279 | +2.8% |
| Equity ratio | 71.2% | 68.9% | +2.3 pt |
| FY3/2027 guidance — revenue (¥ million) | 280,000 | — | +8.1% |
| FY3/2027 guidance — operating profit (¥ million) | 25,500 | — | +12.8% |
| FY3/2027 guidance — ordinary profit (¥ million) | 26,500 | — | +10.5% |
| FY3/2027 guidance — net profit (¥ million) | 19,000 | — | +3.4% |
| FY3/2027 guidance — EPS (¥) | 249.86 | — | n.m. |
| Annual dividend per share (¥) | 66.00 | 60.00 | +10.0% |
JapanStockPulse provides informational content only and does not constitute investment advice. Figures are taken from the company's published earnings short report and may be subject to subsequent revision.