Half a year of results for 384 subsidiaries, so the filing prints no growth rates
Mitsui O.S.K. Lines, Ltd. (TSE: 9104), the Japanese ocean-shipping group whose reporting segments run from dry bulk, energy and chemical logistics to container ships, car carriers, real estate and ferries, published consolidated results for the first quarter of FY3/2027, the three months from April 1 to June 30, 2026, on August 7, 2026 under Japanese GAAP. Revenue was ¥730,987 million against ¥432,704 million a year earlier, operating profit ¥38,516 million against ¥37,078 million, ordinary profit ¥52,153 million against ¥52,233 million, and profit attributable to owners of the parent ¥61,056 million against ¥52,817 million, for earnings of ¥177.69 per share against ¥152.89. The shares are listed on the Tokyo Stock Exchange.
Those pairs are not like-for-like, and the filing says so. From this quarter, 384 consolidated subsidiaries that previously closed their books on December 31 either moved their year-end to March 31 or began to be consolidated on provisional accounts drawn up to the group's March 31 date. As a result the quarter includes those companies for six months, from January 1 to June 30, 2026, and the summary table prints a dash instead of a year-on-year percentage on every profit line. The filing quantifies the extra period, January 1 to March 31, 2026: ¥207,481 million of revenue, ¥8,422 million of operating profit and ¥3,874 million of ordinary profit, plus ¥3,395 million of pre-tax profit.
On the adjusted basis, revenue grew and operating profit fell
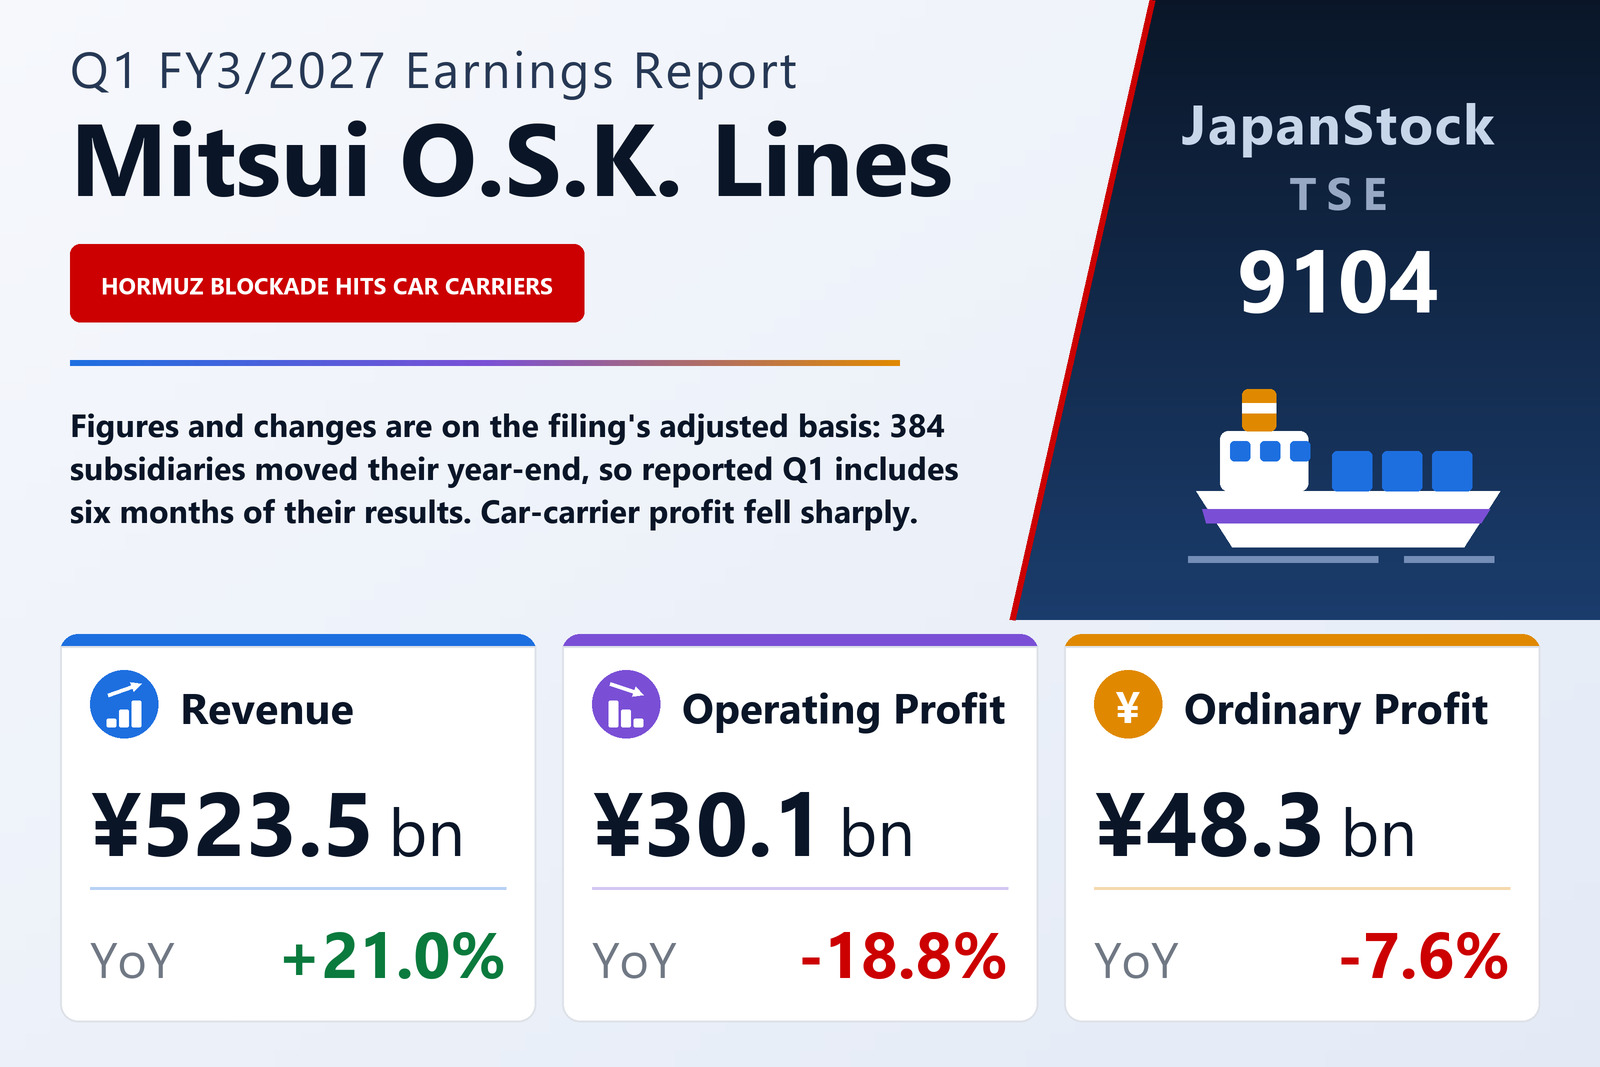
The filing also publishes a reference set of adjusted rates, which count the 384 subsidiaries for April to June only. On that basis revenue was ¥523,506 million, up 21.0%, operating profit ¥30,093 million, down 18.8%, and ordinary profit ¥48,278 million, down 7.6%. It gives no adjusted figure for net profit. The underlying picture is therefore the reverse of the reported one: a larger business earning less at the operating line. Two market inputs frame it. The average exchange rate was ¥159.14 to the dollar, ¥13.89 weaker than a year earlier, which lifts yen revenue, and the average bunker price rose by US$373 to US$917 per tonne from US$544, a cost the filing names again and again in its segment commentary.
On the reported figures, cost of sales rose to ¥623,300 million from ¥351,605 million and selling, general and administrative expenses to ¥69,170 million from ¥44,020 million, leaving gross profit of ¥107,686 million against ¥81,099 million. The reported gross margin was 14.7% against 18.7% and the operating margin 5.3% against 8.6%, although both are distorted by the longer consolidation period. Depreciation, including amortisation of intangible assets other than goodwill, doubled to ¥78,554 million from ¥39,161 million.
Below the operating line: heavier interest, a currency swing and an asset sale
Non-operating items moved sharply in both directions and roughly cancelled out. Interest expense nearly tripled, to ¥25,227 million from ¥9,177 million, while interest income rose to ¥9,267 million from ¥4,348 million. Foreign exchange swung from a ¥5,544 million loss to an ¥11,800 million gain. Equity-method investment income was almost unchanged at ¥13,959 million against ¥13,852 million, even though the filing says its equity-method container-shipping affiliate OCEAN NETWORK EXPRESS earned less than a year earlier, as higher fuel costs outweighed freight rates that rose from May. Ordinary profit ended at ¥52,153 million, ¥80 million below the prior year.
The step-up at the bottom line came from extraordinary items. Extraordinary gains were ¥17,058 million against ¥10,197 million, led by ¥13,404 million of gains on the sale of non-current assets against ¥681 million; the filing does not say which assets were sold. Extraordinary losses were ¥1,140 million. Pre-tax profit was therefore ¥68,071 million against ¥61,662 million, income taxes fell to ¥6,737 million from ¥7,210 million, and profit attributable to non-controlling interests dropped to ¥278 million from ¥1,635 million, which is how a flat ordinary profit became net profit ¥8,239 million higher. Comprehensive income was ¥144,442 million against a loss of ¥76,004 million, as foreign-currency translation adjustments (+¥46,862 million), the share of equity-method affiliates' other comprehensive income (+¥30,424 million) and deferred hedge gains (+¥8,672 million) all turned positive.
Car carriers took the hit; dry bulk swung back to profit
MOL measures segment profit at the ordinary-profit level. From this quarter it has created a Chemical Logistics segment out of product tankers, chemical tankers and methanol carriers previously in Energy and tank terminals previously in Car Carriers, Port & Logistics, and the prior year has been restated. The largest move came in Car Carriers, Port & Logistics, whose segment profit fell to ¥1,742 million from ¥23,402 million on revenue of ¥177,396 million against ¥127,793 million. For car carriers the filing cites the suspension of sailings to the Persian Gulf after the closure of the Strait of Hormuz, higher fuel costs and routing constraints from congestion at some ports, while demand for finished-vehicle shipping held firm; air and sea logistics volumes were also below the prior year. The subsidiary year-end change reduced this segment's profit by ¥1,393 million, so it does not explain the fall.
Energy segment profit fell to ¥15,062 million from ¥22,026 million on revenue of ¥115,278 million against ¥61,363 million. Crude and LPG tanker markets were above the prior year as disrupted Middle East cargo lengthened voyages, and the FPSO business earned more, but the LNG and ethane carrier business lost a one-off gain from a refinancing booked in the prior-year quarter and gas infrastructure earned less after some contracts ended. Dry Bulk moved the other way, to a segment profit of ¥10,722 million from a loss of ¥3,448 million on revenue of ¥177,174 million against ¥107,156 million, as Capesize and smaller bulker markets rose from late April and the Gearbulk open-hatch business improved its profitability.
Chemical Logistics earned ¥8,482 million against ¥7,086 million on revenue of ¥164,808 million against ¥65,159 million, but ¥73,698 million of that revenue and ¥2,717 million of that profit came from the longer consolidation period, the largest such effect in any segment; without it, segment profit would have been about ¥5,765 million. Containerships fell to ¥5,264 million from ¥7,372 million. Real Estate rose to ¥4,693 million from ¥1,884 million, helped by UK buildings acquired last year, with ¥1,544 million of the total coming from the year-end change. Ferries, Coastal RORO & Cruises lost ¥2,767 million against ¥1,264 million, on fewer sailings in bad weather, weak cargo, higher fuel costs and slow take-up of demand for the MITSUI OCEAN FUJI cruise ship, while Associated Businesses earned ¥1,201 million against ¥561 million on firm towage work.
Ships and long-term borrowings expanded the balance sheet
Total assets rose 4.0% to ¥6,202,420 million from ¥5,962,245 million at March 31, 2026, mainly on vessels, which increased to ¥1,432,976 million from ¥1,353,598 million. Liabilities rose to ¥3,166,460 million from ¥3,033,172 million, mainly on long-term borrowings, which reached ¥1,839,514 million from ¥1,724,321 million; lease obligations also grew, to ¥200,248 million from ¥161,690 million. Net assets increased 3.6% to ¥3,035,960 million, chiefly on foreign-currency translation adjustments, and the equity ratio edged down to 48.0% from 48.2%. The company did not prepare a quarterly cash-flow statement.
Guidance, raised on August 3, left unchanged
MOL kept its guidance unchanged with these results, but it had already raised it in a separate release on August 3, 2026. It now expects FY3/2027 revenue of ¥2,230,000 million (+22.2%), operating profit of ¥135,000 million (+6.3%), ordinary profit of ¥225,000 million (+28.0%) and profit attributable to owners of the parent of ¥240,000 million (+12.5%), or ¥698.27 per share, up from April 30 targets of ¥2,040,000 million, ¥105,000 million, ¥145,000 million and ¥170,000 million respectively. For the first half it guides revenue of ¥1,235,000 million, ordinary profit of ¥126,000 million and net profit of ¥137,000 million, which implies ordinary profit of about ¥73,847 million in the second quarter alone, against ¥52,153 million in the first. The guidance assumes an exchange rate of ¥156.55 to the dollar and, for the segment forecasts, that the Persian Gulf reopens to limited traffic in both directions from around October 2026 and returns to pre-conflict conditions around January 2027, while the Red Sea stays closed all year.
The dividend forecast is unchanged at ¥205.00 per share for the year, ¥100.00 at the half and ¥105.00 at the year-end, against ¥200.00 for FY3/2026, which was paid as ¥85.00 and ¥115.00. That is about 29% of the guided ¥698.27 of earnings per share.
| Metric | Q1 FY3/2027 | Q1 FY3/2026 | Change |
|---|---|---|---|
| Revenue (¥ million) | 730,987 | 432,704 | n.m. |
| Revenue, adjusted basis (¥ million) | 523,506 | 432,704 | +21.0% |
| Gross profit (¥ million) | 107,686 | 81,099 | n.m. |
| SG&A expenses (¥ million) | 69,170 | 44,020 | n.m. |
| Operating profit (¥ million) | 38,516 | 37,078 | n.m. |
| Operating profit, adjusted basis (¥ million) | 30,093 | 37,078 | −18.8% |
| Equity-method investment income (¥ million) | 13,959 | 13,852 | n.m. |
| Interest expense (¥ million) | 25,227 | 9,177 | n.m. |
| Ordinary profit (¥ million) | 52,153 | 52,233 | n.m. |
| Ordinary profit, adjusted basis (¥ million) | 48,278 | 52,233 | −7.6% |
| Gain on sale of non-current assets (¥ million) | 13,404 | 681 | n.m. |
| Pre-tax profit (¥ million) | 68,071 | 61,662 | n.m. |
| Net profit attrib. to owners of parent (¥ million) | 61,056 | 52,817 | n.m. |
| EPS (¥) | 177.69 | 152.89 | n.m. |
| Comprehensive income (¥ million) | 144,442 | −76,004 | n.m. |
| Dry Bulk — revenue (¥ million) | 177,174 | 107,156 | n.m. |
| Dry Bulk — segment profit (¥ million) | 10,722 | −3,448 | loss to profit |
| Energy — revenue (¥ million) | 115,278 | 61,363 | n.m. |
| Energy — segment profit (¥ million) | 15,062 | 22,026 | n.m. |
| Chemical Logistics — revenue (¥ million) | 164,808 | 65,159 | n.m. |
| Chemical Logistics — segment profit (¥ million) | 8,482 | 7,086 | n.m. |
| Containerships — revenue (¥ million) | 31,117 | 22,256 | n.m. |
| Containerships — segment profit (¥ million) | 5,264 | 7,372 | n.m. |
| Car Carriers, Port & Logistics — revenue (¥ million) | 177,396 | 127,793 | n.m. |
| Car Carriers, Port & Logistics — segment profit (¥ million) | 1,742 | 23,402 | n.m. |
| Real Estate — revenue (¥ million) | 16,713 | 10,880 | n.m. |
| Real Estate — segment profit (¥ million) | 4,693 | 1,884 | n.m. |
| Ferries, Coastal RORO & Cruises — revenue (¥ million) | 19,659 | 18,271 | n.m. |
| Ferries, Coastal RORO & Cruises — segment profit (¥ million) | −2,767 | −1,264 | loss widened |
| Associated Businesses — revenue (¥ million) | 17,104 | 13,742 | n.m. |
| Associated Businesses — segment profit (¥ million) | 1,201 | 561 | n.m. |
| Total assets (¥ million) | 6,202,420 | 5,962,245 | +4.0% |
| Vessels, net (¥ million) | 1,432,976 | 1,353,598 | +5.9% |
| Long-term borrowings (¥ million) | 1,839,514 | 1,724,321 | +6.7% |
| Net assets (¥ million) | 3,035,960 | 2,929,073 | +3.6% |
| Equity ratio | 48.0% | 48.2% | −0.2 pt |
| FY3/2027 guidance — revenue (¥ million) | 2,230,000 | — | +22.2% |
| FY3/2027 guidance — operating profit (¥ million) | 135,000 | — | +6.3% |
| FY3/2027 guidance — ordinary profit (¥ million) | 225,000 | — | +28.0% |
| FY3/2027 guidance — net profit (¥ million) | 240,000 | — | +12.5% |
| Annual dividend per share (¥) | 205.00 | 200.00 | +2.5% |
JapanStockPulse provides informational content only and does not constitute investment advice. Figures are taken from the company's published earnings short report and may be subject to subsequent revision.