Profit growing faster than revenue, at every line
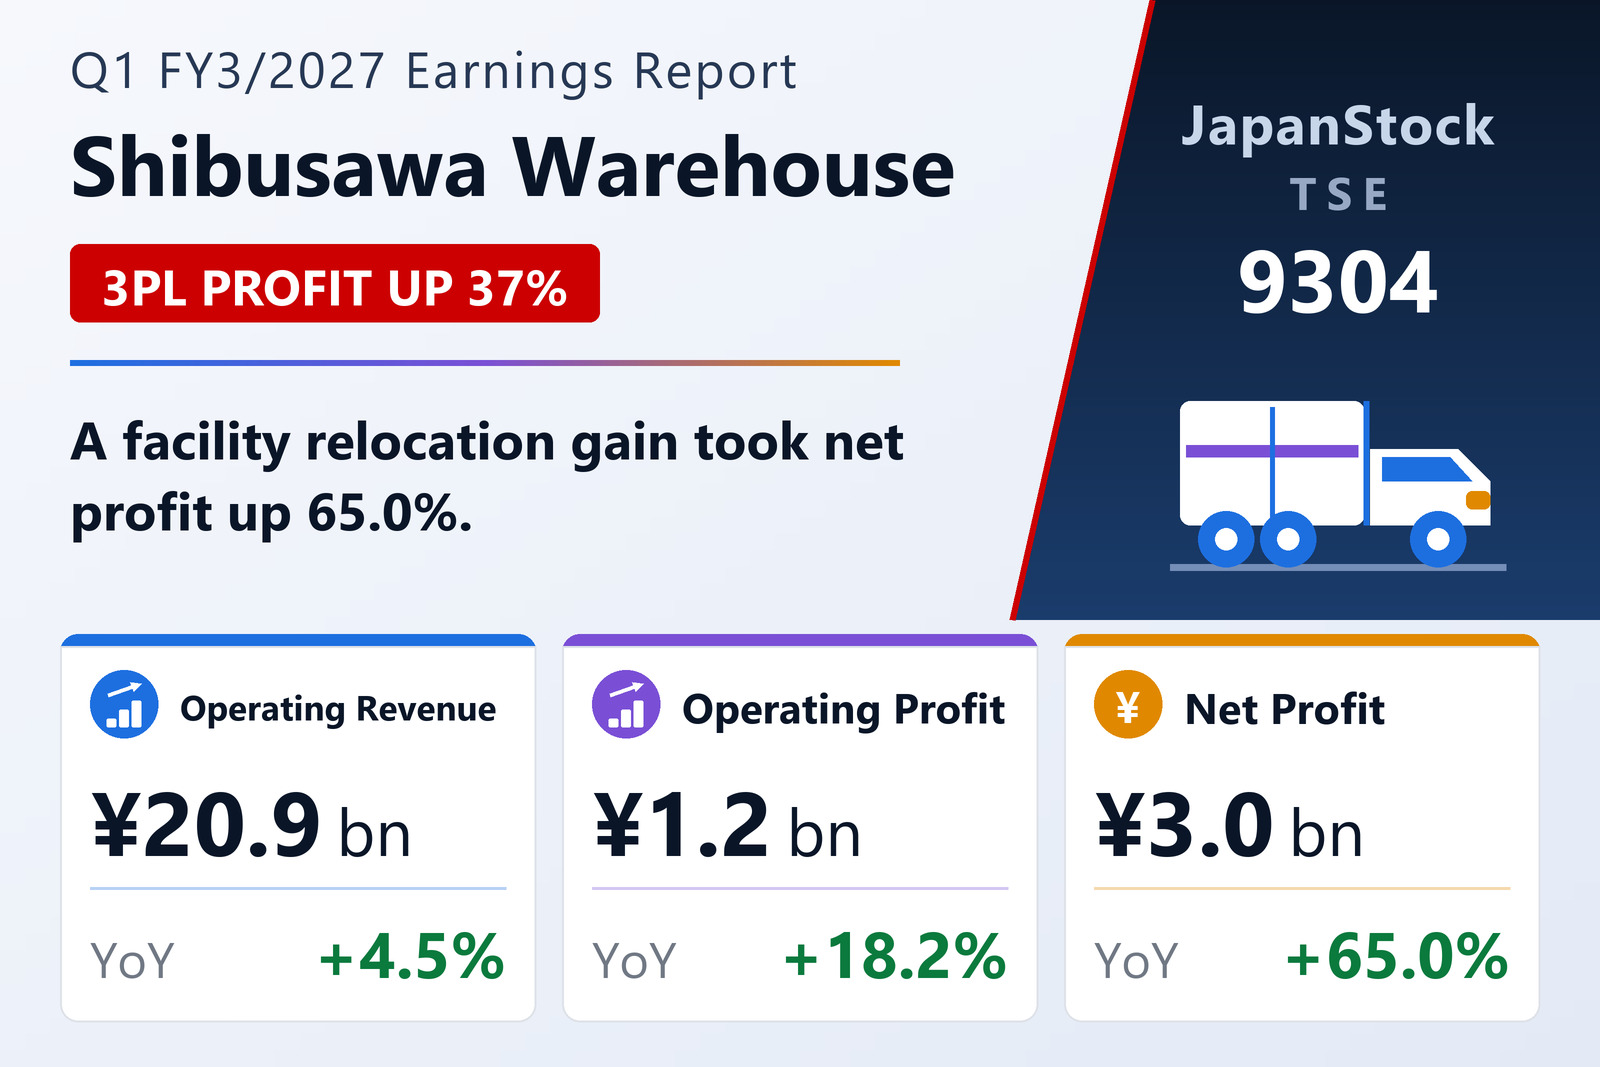
The Shibusawa Warehouse Co., Ltd. (TSE: 9304) published consolidated results for the three months to June 30, 2026 on August 7, 2026 under Japanese GAAP. Operating revenue rose 4.5% to ¥20,930 million, operating profit 18.2% to ¥1,195 million, ordinary profit 25.6% to ¥1,816 million and net profit attributable to owners of the parent 65.0% to ¥2,998 million, for earnings per share of ¥52.71 against ¥31.57.
Each step up that ladder has its own cause. Operating profit outgrew revenue on mix; ordinary profit outgrew operating profit on non-operating income; and net profit outgrew ordinary profit because of an extraordinary gain recorded on the relocation of a logistics facility. Only the first of the three is a recurring operating improvement, which is worth holding in mind against the headline 65%.
Logistics: 3PL doing the work
The logistics segment lifted revenue 4.7% to ¥19,472 million and segment profit 37.4% to ¥1,207 million — profit growing at eight times the rate of revenue. Within it, third-party logistics is the engine: revenue of ¥10,562 million (+5.4%) on segment profit of ¥797 million, up 36.5%. That single sub-business is over half the segment's revenue and two-thirds of its profit.
Elsewhere in logistics, port transport contributed ¥2,213 million of revenue and ¥185 million of profit, land transport ¥4,292 million and ¥372 million, and other logistics services ¥292 million and ¥219 million. International transport was flat on revenue at ¥2,111 million (+0.3%) but lifted profit 79.1% to ¥135 million — the same pattern as 3PL, margin rather than volume.
Real estate: small, steady, and highly profitable
The real estate segment produced revenue of ¥1,518 million (+3.3%) and segment profit of ¥772 million (+3.8%). It is 7% of group revenue but roughly 39% of combined segment profit, at a margin above 50% — the leasing income that a warehouse operator's land holdings throw off, and the quiet stabiliser under a logistics business whose margins are thinner.
Balance sheet, a new subsidiary, and a stock split
Total assets rose 8.0% from the March year-end to ¥128,876 million and net assets 5.1% to ¥71,910 million, so the equity ratio slipped to 55.7% from 57.3% — assets growing faster than equity, which for a warehouse operator normally means facility investment. Comprehensive income was ¥5,631 million against ¥1,131 million. During the quarter, Shibusawa World Transport Co., Ltd. was newly consolidated.
Guidance for FY3/2027 is unchanged: operating revenue of ¥90,000 million (+12.9%), operating profit of ¥5,300 million (+29.4%), ordinary profit of ¥6,000 million (+23.5%) and net profit of ¥7,200 million (+13.7%), for earnings per share of ¥128.87. The first-half targets are ¥44,000 million, ¥2,800 million, ¥3,400 million and ¥4,800 million respectively; the quarter has delivered 42.7% of the operating-profit half-year target.
The annual dividend forecast is ¥90.00 per share. It cannot be read straight against the prior year's headline figure, because the company carried out a 4-for-1 stock split effective October 1, 2025. On a split-adjusted basis the prior annual dividend was ¥56.00, so the forecast represents an increase of 60.7% — the per-share figures throughout this table are on the post-split basis.
| Metric | Q1 FY3/2027 | Q1 FY3/2026 | Change |
|---|---|---|---|
| Operating revenue (¥ million) | 20,930 | 20,022 | +4.5% |
| Operating profit (¥ million) | 1,195 | 1,011 | +18.2% |
| Ordinary profit (¥ million) | 1,816 | 1,445 | +25.6% |
| Net profit attrib. to owners of parent (¥ million) | 2,998 | 1,817 | +65.0% |
| Comprehensive income (¥ million) | 5,631 | 1,131 | +397.8% |
| EPS (¥) | 52.71 | 31.57 | +67.0% |
| Logistics — revenue (¥ million) | 19,472 | 18,604 | +4.7% |
| Logistics — segment profit (¥ million) | 1,207 | 878 | +37.4% |
| Real Estate — revenue (¥ million) | 1,518 | 1,469 | +3.3% |
| Real Estate — segment profit (¥ million) | 772 | 743 | +3.8% |
| Total assets (¥ million) | 128,876 | 119,301 | +8.0% |
| Net assets (¥ million) | 71,910 | 68,441 | +5.1% |
| Equity ratio | 55.7% | 57.3% | −1.6 pt |
| FY3/2027 guidance — operating revenue (¥ million) | 90,000 | — | +12.9% |
| FY3/2027 guidance — operating profit (¥ million) | 5,300 | — | +29.4% |
| FY3/2027 guidance — ordinary profit (¥ million) | 6,000 | — | +23.5% |
| FY3/2027 guidance — net profit (¥ million) | 7,200 | — | +13.7% |
| FY3/2027 guidance — EPS (¥) | 128.87 | — | n.m. |
| Annual dividend per share (¥) | 90.00 | 56.00 | +60.7% |
JapanStockPulse provides informational content only and does not constitute investment advice. Figures are taken from the company's published earnings short report and may be subject to subsequent revision.