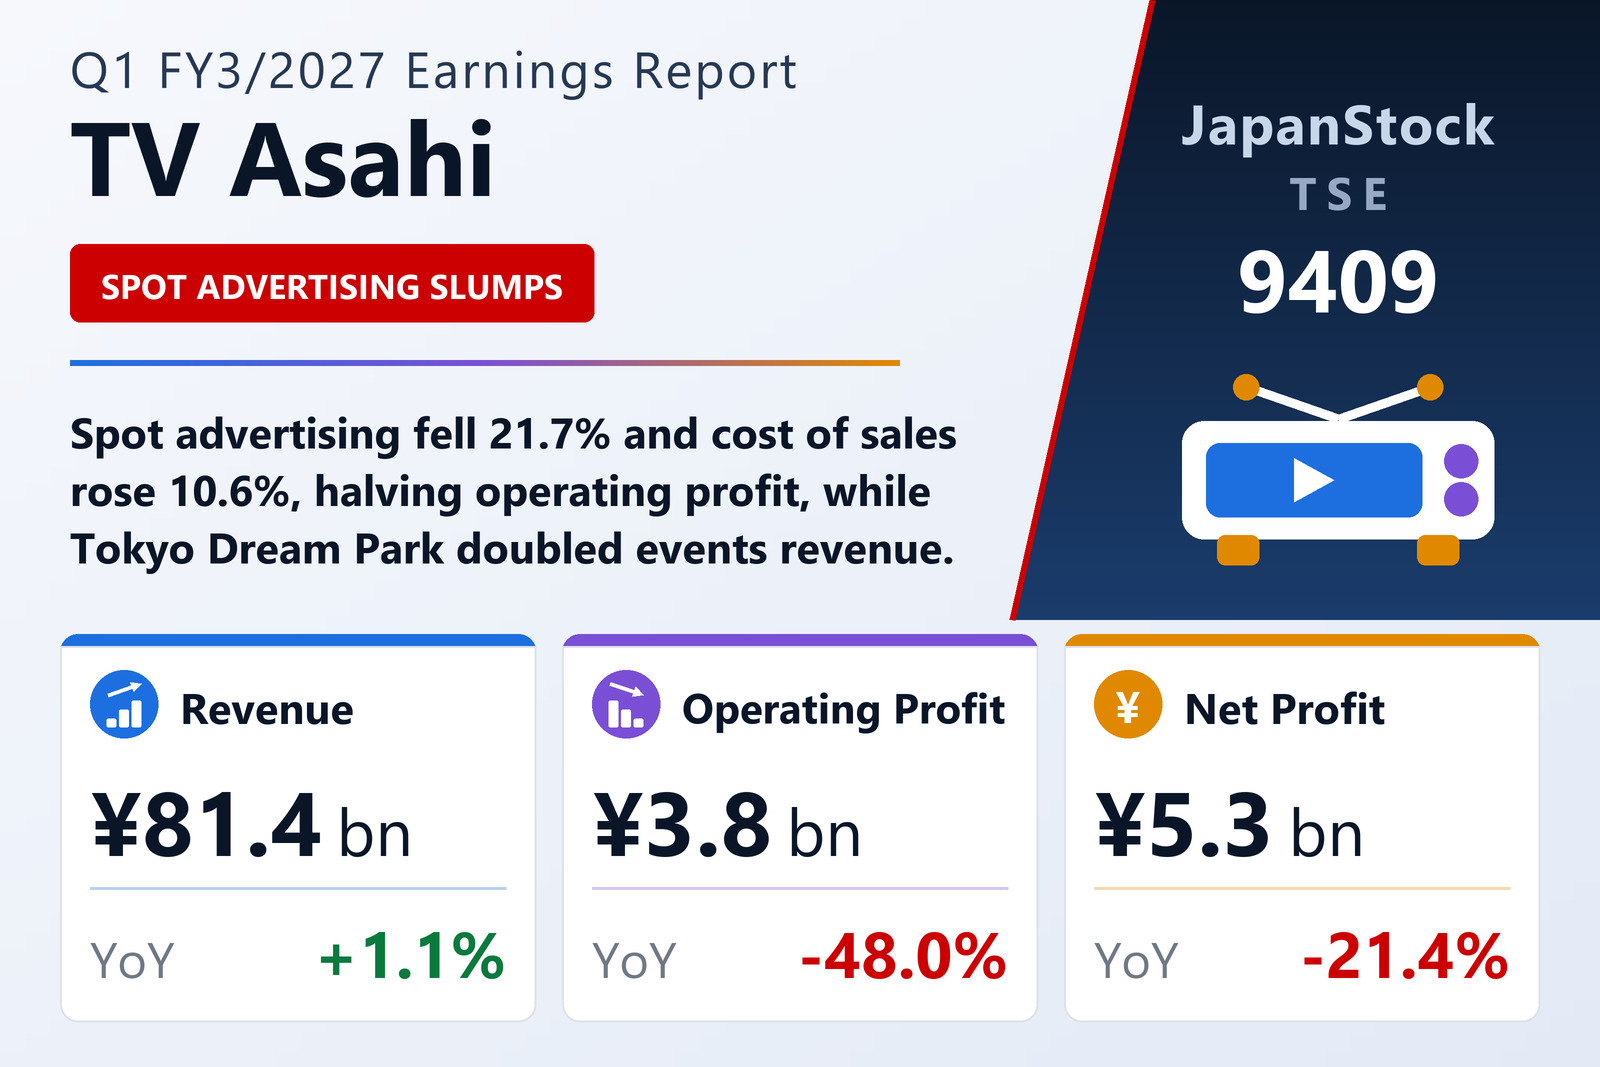
Revenue up 1.1%, operating profit down 48.0%
TV Asahi Holdings Corp. (TSE: 9409), the holding company of the TV Asahi broadcasting group, published consolidated results for the first quarter of the fiscal year ending March 2027 — the three months from April 1 to June 30, 2026 — on August 7, 2026 under Japanese GAAP. Revenue rose 1.1% to ¥81,386 million, operating profit fell 48.0% to ¥3,792 million, ordinary profit fell 32.4% to ¥6,641 million and profit attributable to owners of the parent fell 21.4% to ¥5,260 million, for earnings of ¥52.32 per share against ¥66.08. The filing names the Tokyo Stock Exchange as the listing venue, and the quarterly statements were not reviewed by an auditor.
The gap between those first two lines is a cost story. Cost of sales rose 10.6% to ¥60,856 million against revenue growth of just 1.1%, so gross profit fell 19.3% to ¥20,529 million and the gross margin narrowed from 31.6% to 25.2%. Selling, general and administrative expenses fell 7.7% to ¥16,736 million, which recovered only part of that loss: the two cost lines together came to ¥77,593 million, up 6.0%, and the operating margin halved from 9.1% to 4.7%. The prior-year figures reflect a reclassification of ¥875 million from cost of sales to SG&A that followed a July 2025 merger of two consolidated subsidiaries; the filing states it has no effect on operating profit.
Spot advertising is the main drag
Media & Content, by far the largest segment, reported revenue of ¥68,938 million, down 6.9%, and segment profit of ¥3,028 million, down 56.9% from ¥7,025 million; its operating expenses fell only 1.7%, to ¥65,910 million. The weak line was spot revenue, which fell 21.7% to ¥20,168 million. The filing attributes the drop mainly to a reaction against special demand in the prior-year quarter; by advertiser sector, hobby and sporting goods and energy, materials and machinery grew, while pharmaceuticals and medical supplies, beverages and luxury goods, transport and leisure, and information and communications all declined.
Time revenue held almost flat at ¥19,446 million, down 0.4%. Regular programmes, the base of the business, grew on what the filing calls resilient corporate earnings, and one-off sales such as the Rally Japan 2026 round of the World Rally Championship and a Japan qualifier for the NBA Rising Stars Invitational limited the decline left by last year's World Team Trophy figure skating and FIFA World Cup 2026 Asian qualifiers. Internet revenue rose 4.6% to ¥7,996 million on strong commissioned production, programme sales rose 11.4% to ¥3,603 million on overseas anime sales, while BS/CS revenue fell 3.9% to ¥6,183 million and shopping revenue 4.9% to ¥3,997 million.
Tokyo Dream Park doubles the events segment
TDP & Events revenue rose 103.9% to ¥12,164 million, driven by events held at Tokyo Dream Park, which opened on March 27, 2026, and by higher music-publishing revenue as Ketsumeishi, an artist under the group, went on a concert tour. Operating expenses rose almost as fast, 99.7% to ¥11,674 million, so segment profit reached ¥489 million against ¥120 million, up 304.9%. Other businesses grew revenue 19.8% to ¥2,641 million and profit 88.5% to ¥305 million, helped by video-equipment rental for concerts and events. In money terms the new growth does not come close to offsetting the broadcast side: TDP & Events added ¥369 million of segment profit while Media & Content lost ¥3,997 million.
The segments themselves are new. From this quarter the group reports three segments instead of the former four — TV broadcasting, internet, shopping and other — following a management plan for fiscal 2026 to 2029 adopted by the board on February 12, 2026. Prior-year segment figures have been restated on the new basis. Segment revenues include ¥2,357 million of intersegment sales, which is why they sum to ¥83,743 million against group revenue of ¥81,386 million.
Below the operating line: equity-method income, a one-off gain and a wind-down provision
Non-operating income rose to ¥2,921 million from ¥2,609 million, chiefly equity-method investment income of ¥1,843 million (¥1,683 million a year earlier) and dividends received of ¥844 million, against non-operating expenses of only ¥73 million. That cushion is why ordinary profit fell a smaller 32.4%. The quarter also carried extraordinary items that were absent a year earlier: a ¥475 million gain on step acquisition from making New Japan Pro-Wrestling a subsidiary, and ¥744 million of extraordinary losses, of which ¥565 million is a provision for business losses tied to winding down a group company whose businesses included blockchain-based services, and ¥178 million a provision for doubtful accounts.
Pre-tax profit therefore fell 35.1% to ¥6,372 million. Income taxes, however, dropped to ¥995 million from ¥3,046 million — about 15.6% of pre-tax profit against 31.0% a year earlier. The filing says quarterly tax is calculated using an estimated annual effective rate and gives no further explanation for the lower charge, but it is the reason net profit fell only 21.4% while operating profit halved.
Balance sheet: securities up, cash down
Total assets stood at ¥588,626 million on June 30, 2026, up ¥7,517 million from March 31. Cash and deposits fell ¥13,108 million and receivables ¥9,951 million, while investment securities rose ¥13,814 million, short-term securities ¥13,023 million and inventories ¥1,322 million. Liabilities fell ¥5,606 million to ¥107,816 million, mainly on lower accrued expenses, and net assets rose ¥13,123 million to ¥480,809 million, largely from a ¥10,079 million increase in unrealised gains on securities and a ¥1,750 million rise in non-controlling interests. The equity ratio edged up from 80.1% to 81.0%. Comprehensive income was ¥15,539 million, up 43.1%, nearly three times net profit, because other comprehensive income added ¥10,162 million. No quarterly cash-flow statement was prepared; depreciation was ¥2,737 million against ¥2,230 million.
Guidance and dividend unchanged
TV Asahi left its full-year forecast, published on May 14, 2026, unchanged: revenue of ¥350,000 million (+3.1%), operating profit of ¥20,000 million (down 23.6%), ordinary profit of ¥28,000 million (down 23.4%) and profit attributable to owners of ¥25,000 million (down 15.7%), or ¥248.66 per share. The first quarter delivered 23.3% of guided revenue, 19.0% of guided operating profit and 21.0% of guided net profit. The dividend forecast is also unchanged at ¥50 at the interim and ¥50 at the year-end, ¥100 in total, against ¥70 for FY3/2026, a figure that included a ¥10 special dividend.
| Metric | Q1 FY3/2027 | Q1 FY3/2026 | Change |
|---|---|---|---|
| Revenue (¥ million) | 81,386 | 80,478 | +1.1% |
| Cost of sales (¥ million) | 60,856 | 55,044 | +10.6% |
| Gross profit (¥ million) | 20,529 | 25,433 | −19.3% |
| Gross margin | 25.2% | 31.6% | −6.4 pt |
| SG&A expenses (¥ million) | 16,736 | 18,137 | −7.7% |
| Operating profit (¥ million) | 3,792 | 7,296 | −48.0% |
| Operating margin | 4.7% | 9.1% | −4.4 pt |
| Ordinary profit (¥ million) | 6,641 | 9,819 | −32.4% |
| Pre-tax profit (¥ million) | 6,372 | 9,819 | −35.1% |
| Net profit attrib. to owners of parent (¥ million) | 5,260 | 6,689 | −21.4% |
| EPS (¥) | 52.32 | 66.08 | −20.8% |
| Comprehensive income (¥ million) | 15,539 | 10,859 | +43.1% |
| Media & Content — revenue (¥ million) | 68,938 | 74,076 | −6.9% |
| Media & Content — segment profit (¥ million) | 3,028 | 7,025 | −56.9% |
| TDP & Events — revenue (¥ million) | 12,164 | 5,965 | +103.9% |
| TDP & Events — segment profit (¥ million) | 489 | 120 | +304.9% |
| Other — revenue (¥ million) | 2,641 | 2,205 | +19.8% |
| Other — segment profit (¥ million) | 305 | 162 | +88.5% |
| Total assets (¥ million) | 588,626 | 581,109 | +1.3% |
| Net assets (¥ million) | 480,809 | 467,686 | +2.8% |
| Equity ratio | 81.0% | 80.1% | +0.9 pt |
| FY3/2027 guidance — revenue (¥ million) | 350,000 | — | +3.1% |
| FY3/2027 guidance — operating profit (¥ million) | 20,000 | — | −23.6% |
| FY3/2027 guidance — ordinary profit (¥ million) | 28,000 | — | −23.4% |
| FY3/2027 guidance — net profit (¥ million) | 25,000 | — | −15.7% |
| FY3/2027 guidance — EPS (¥) | 248.66 | — | — |
| Annual dividend per share (¥) | 100.00 | 70.00 | +42.9% |
JapanStockPulse provides informational content only and does not constitute investment advice. Figures are taken from the company's published earnings short report and may be subject to subsequent revision.