Sales grew 6.6%, the gross margin slipped, and costs were held
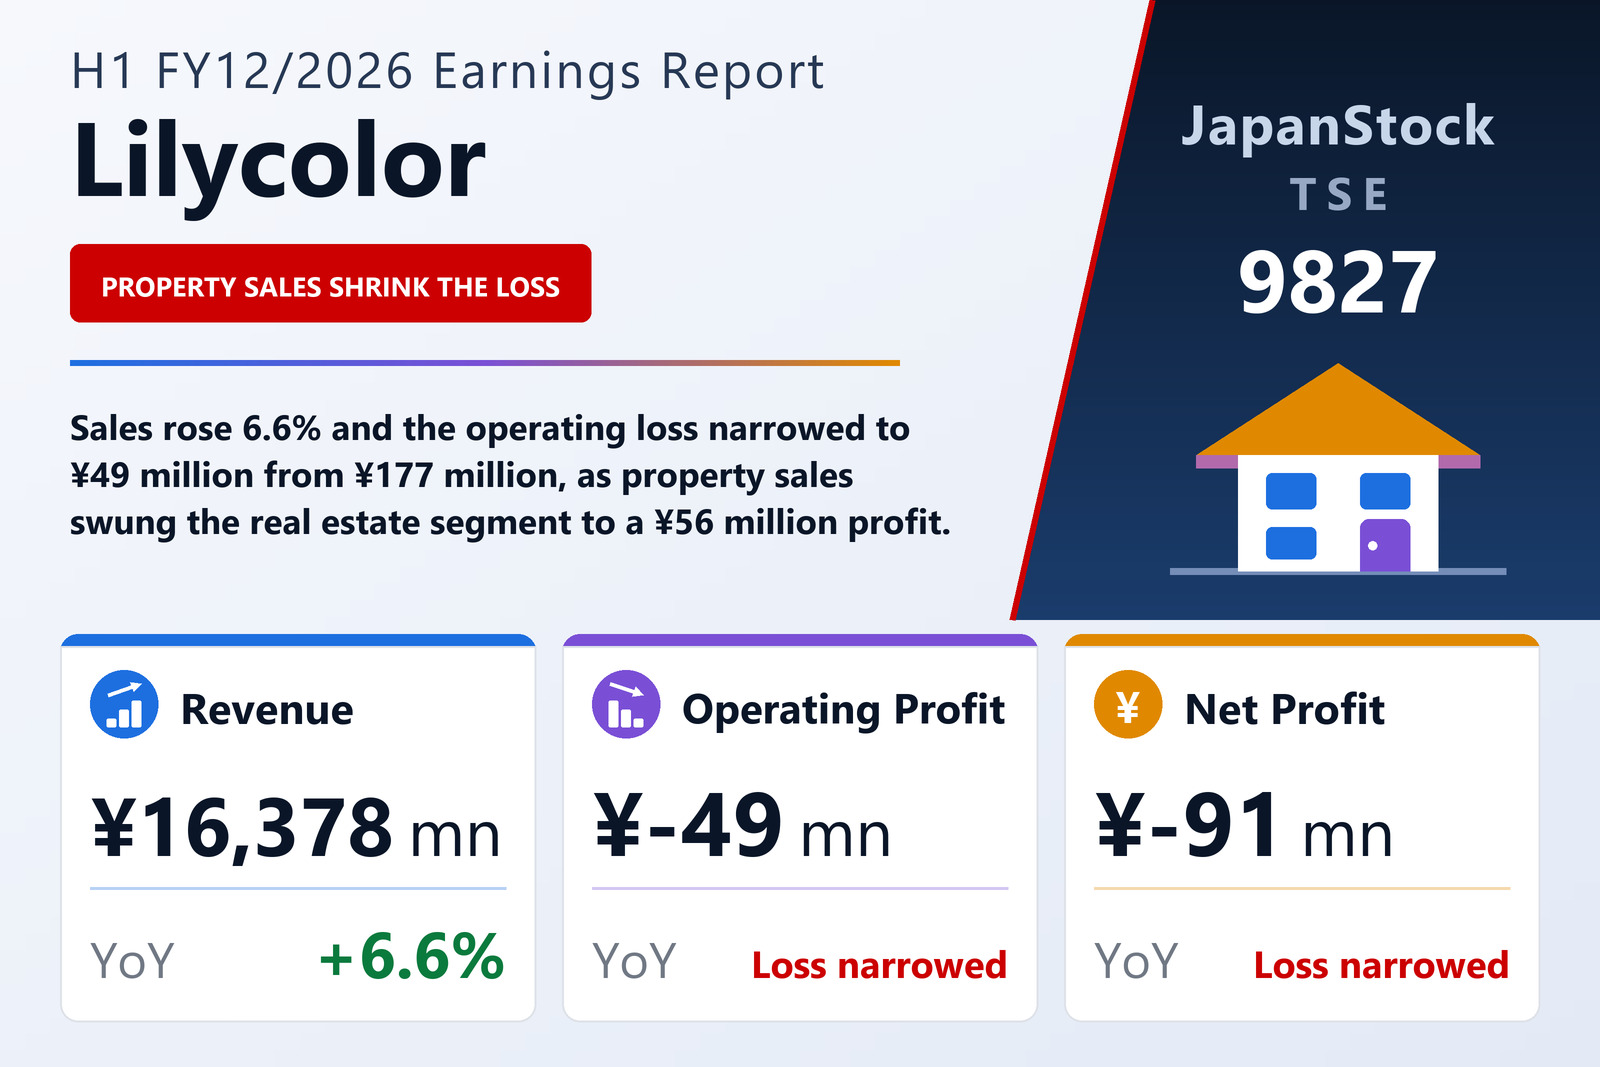
Lilycolor Co., Ltd. (TSE: 9827), which sells interior furnishings such as wallcoverings, curtains and flooring through sample books and also runs space-solutions and real estate investment and development businesses, published non-consolidated results for the first half of FY12/2026 — the six months from January 1 to June 30, 2026 — on August 7, 2026, under Japanese GAAP. Net sales rose 6.6% to ¥16,378 million. The company remained in the red at every profit line, but each loss narrowed: the operating loss to ¥49 million from ¥177 million, the ordinary loss to ¥125 million from ¥220 million and the interim net loss to ¥91 million from ¥146 million, a loss of ¥7.39 per share against ¥11.88.
The improvement came from volume and cost control rather than margin. Cost of sales rose 8.5% to ¥10,975 million, faster than sales, so gross profit grew only 2.9% to ¥5,402 million and the gross margin slipped from 34.2% to 33.0%; the filing does not explain the margin decline. Selling, general and administrative expenses, however, rose just 0.5% to ¥5,452 million, so most of the extra ¥153 million of gross profit was kept and the operating loss shrank by about ¥128 million.
Financing costs widened the gap below the operating line
Non-operating items took more away than a year earlier. Non-operating income fell to ¥16 million from ¥21 million, while non-operating expenses rose to ¥92 million from ¥64 million: interest expense climbed to ¥25 million from ¥15 million, losses on the sale of electronically recorded receivables to ¥34 million from ¥26 million, and commission fees to ¥21 million from ¥1 million. The ordinary loss therefore narrowed by less than the operating loss, to ¥125 million. There were no extraordinary items this half, whereas the prior-year half booked a ¥52 million gain on the sale of investment securities, so the pre-tax loss was ¥125 million against ¥167 million. A net tax credit of ¥34 million, mostly deferred, brought the interim net loss to ¥91 million.
Sample books carried the volume; property sales supplied the profit
Interior, much the largest segment, grew sales 3.2% to ¥12,754 million and narrowed its segment loss to ¥73 million from ¥96 million. The company credits new sample books — the Fabric Deco curtain book in February and the Will and Base wallcovering books in May and June — together with reprints of existing wallcovering, curtain and cushion-floor books. Space Solutions, which designs office spaces and upgrades facilities for corporate clients, slipped 0.4% to ¥2,979 million; the filing says some clients reviewed construction plans in response to the situation in Iran. Its segment loss nonetheless narrowed, to ¥32 million from ¥63 million.
Real Estate Investment and Development made the decisive difference. On sales of value-add properties, its sales rose to ¥644 million from ¥13 million and it swung to a segment profit of ¥56 million from a loss of ¥17 million — a ¥74 million improvement that accounts for more than half of the narrowing in the company's operating loss. The three segments sum exactly to the income statement; there are no intersegment sales.
Housing starts are only beginning to recover
The filing describes a difficult backdrop for interiors. New housing starts, the industry's key indicator, fell sharply from April 2025 as the rush of demand ahead of the revision of the Building Standards Act unwound, and have only begun to pick up slightly since April 2026. Against that, the company says it pursued its medium-term management plan, Beyond-120, as revised in February 2026, focusing on rebuilding its business portfolio, management conscious of the cost of capital, and investment in people.
Cash went into property inventory and supplier payments
Total assets fell 2.8% to ¥19,750 million from ¥20,315 million at December 31, 2025. Cash and deposits dropped by ¥779 million to ¥3,196 million and trade receivables by ¥721 million, while real estate for sale in process rose by ¥1,037 million to ¥1,543 million and completed real estate for sale of ¥541 million was sold down to zero. Operating cash flow was an outflow of ¥1,872 million against an inflow of ¥580 million a year earlier, chiefly because trade payables fell by ¥1,251 million and inventories rose by ¥659 million. Short-term borrowings rose to ¥2,616 million from ¥774 million, so financing cash flow was an inflow of ¥1,123 million after ¥440 million of dividends paid.
Net assets fell 6.7% to ¥7,578 million, mainly because retained earnings dropped by ¥534 million as the year-end dividend was paid on top of the interim loss, and the equity ratio slipped from 40.0% to 38.4%. Long-term borrowings fell by ¥226 million to ¥1,154 million.
Guidance still requires a much stronger second half
Lilycolor left its FY12/2026 guidance, published on February 13, 2026, unchanged: net sales of ¥36,000 million (+8.4%), operating profit of ¥1,000 million (+24.9%), ordinary profit of ¥850 million (+16.8%) and net profit of ¥670 million (+28.1%), or ¥54.39 per share. Against the first half, that implies second-half sales of about ¥19,622 million and operating profit of about ¥1,049 million; the filing does not comment on the split between the halves. It adds that the earthquake in the Kumamoto region of Kumamoto Prefecture on July 28 is not reflected in the forecast, because its effect on the market cannot yet be reasonably estimated, and says its employees and its offices' buildings and equipment suffered no major damage.
The dividend forecast is also unchanged. No interim dividend was paid, and a year-end dividend of ¥36.00 per share is planned, the same as the ¥36.00 paid for FY12/2025.
| Metric | H1 FY12/2026 | H1 FY12/2025 | Change |
|---|---|---|---|
| Net sales (¥ million) | 16,378 | 15,364 | +6.6% |
| Gross profit (¥ million) | 5,402 | 5,249 | +2.9% |
| Gross margin | 33.0% | 34.2% | −1.2 pt |
| SG&A expenses (¥ million) | 5,452 | 5,427 | +0.5% |
| Operating profit (¥ million) | −49 | −177 | loss narrowed |
| Ordinary profit (¥ million) | −125 | −220 | loss narrowed |
| Net profit (¥ million) | −91 | −146 | loss narrowed |
| EPS (¥) | −7.39 | −11.88 | loss narrowed |
| Interior — revenue (¥ million) | 12,754 | 12,360 | +3.2% |
| Interior — segment profit (¥ million) | −73 | −96 | loss narrowed |
| Space Solutions — revenue (¥ million) | 2,979 | 2,991 | −0.4% |
| Space Solutions — segment profit (¥ million) | −32 | −63 | loss narrowed |
| Real Estate Investment & Development — revenue (¥ million) | 644 | 13 | n.m. |
| Real Estate Investment & Development — segment profit (¥ million) | 56 | −17 | loss to profit |
| Total assets (¥ million) | 19,750 | 20,315 | −2.8% |
| Net assets (¥ million) | 7,578 | 8,122 | −6.7% |
| Equity ratio | 38.4% | 40.0% | −1.6 pt |
| FY12/2026 guidance — revenue (¥ million) | 36,000 | — | +8.4% |
| FY12/2026 guidance — operating profit (¥ million) | 1,000 | — | +24.9% |
| FY12/2026 guidance — ordinary profit (¥ million) | 850 | — | +16.8% |
| FY12/2026 guidance — net profit (¥ million) | 670 | — | +28.1% |
| FY12/2026 guidance — EPS (¥) | 54.39 | — | — |
| Annual dividend per share (¥) | 36.00 | 36.00 | unchanged |
JapanStockPulse provides informational content only and does not constitute investment advice. Figures are taken from the company's published earnings short report and may be subject to subsequent revision.