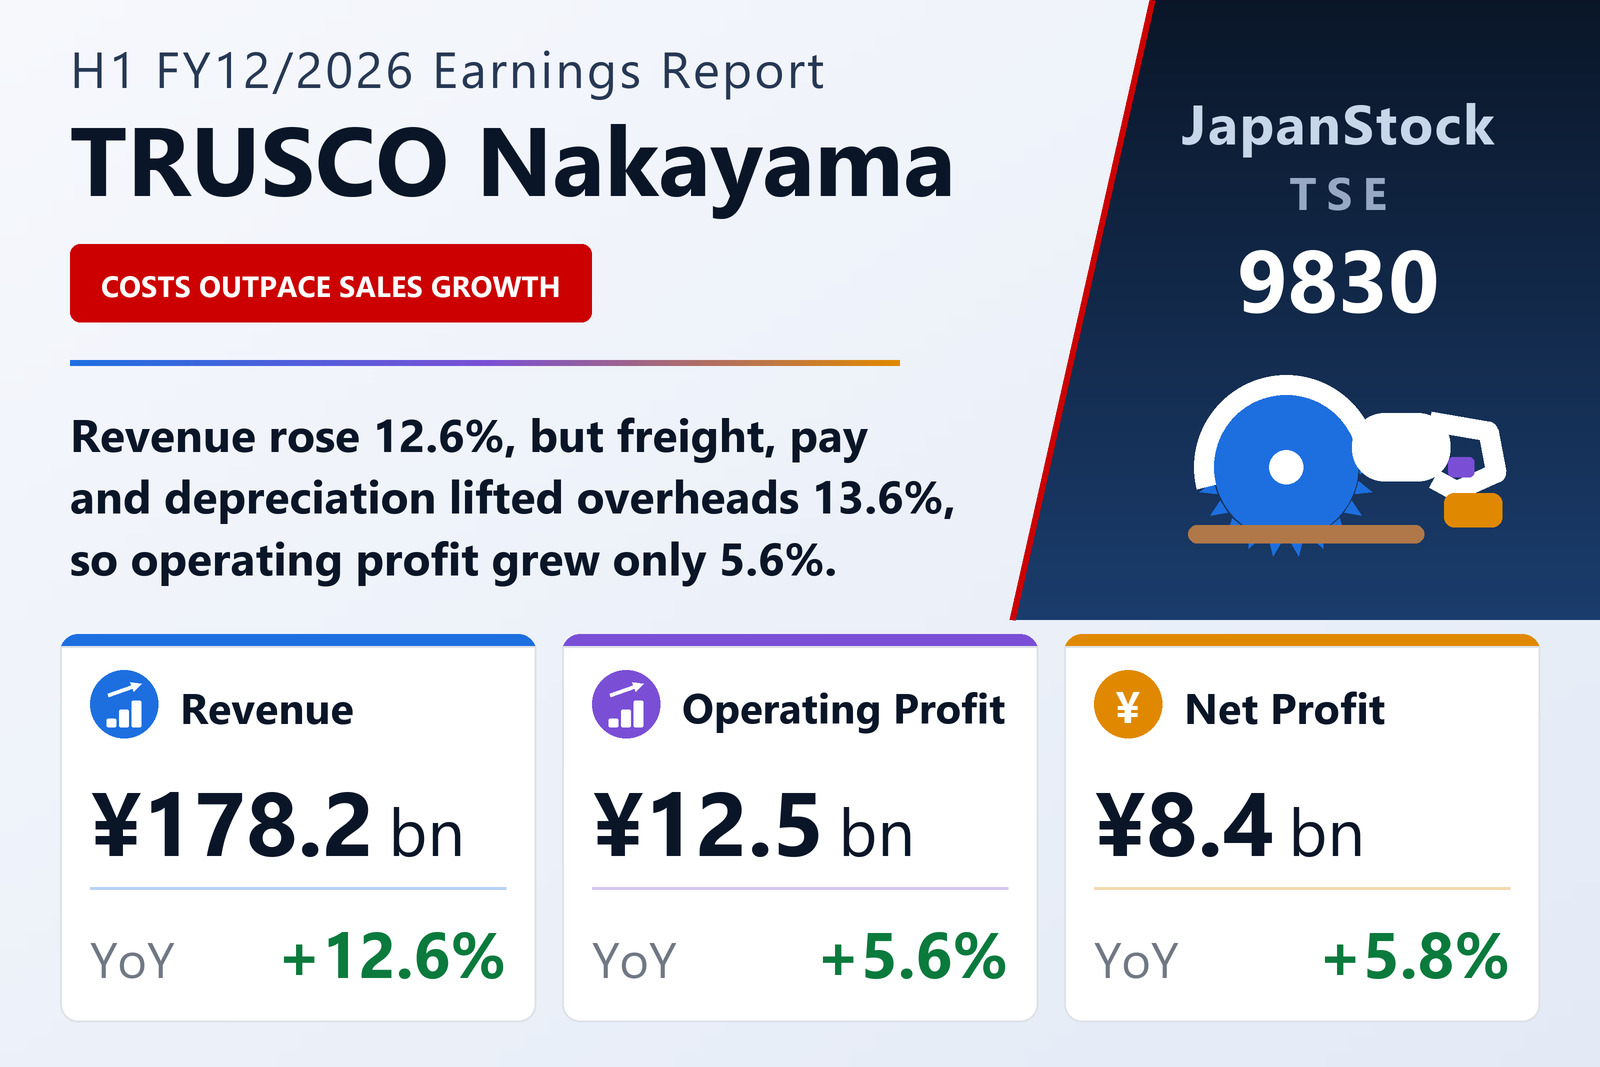
Revenue grew 12.6%, operating profit 5.6% — costs grew faster than sales
TRUSCO NAKAYAMA CORPORATION (TSE: 9830), the wholesaler of work supplies, safety products, hand tools and other factory consumables to manufacturers, construction firms, online retailers and home centres, published consolidated results for the first half of its fiscal year ending December 2026 — the six months from January 1 to June 30, 2026 — on August 7, 2026, under Japanese GAAP. Revenue rose 12.6% to ¥178,204 million, EBITDA (which the company defines as operating profit plus depreciation) 9.0% to ¥15,889 million, operating profit 5.6% to ¥12,483 million, ordinary profit 4.3% to ¥12,217 million and profit attributable to owners of the parent 5.8% to ¥8,444 million, for earnings of ¥128.07 per share against ¥121.08. The shares are listed on the Tokyo Stock Exchange.
Each line grew more slowly than the one above it, and the income statement shows why. Cost of sales rose 13.1% to ¥141,297 million, a little faster than revenue, so gross profit grew 10.7% to ¥36,907 million and the gross margin slipped from 21.1% to 20.7%; the filing states the lower margin but does not explain it. Selling, general and administrative expenses then grew 13.6% to ¥24,424 million. In money terms, the half added ¥19,971 million of revenue and ¥3,573 million of gross profit, SG&A absorbed ¥2,915 million of that, and ¥658 million reached operating profit. The operating margin fell from 7.5% to 7.0%.
Freight, a pay rise and two new systems account for most of the SG&A increase
The filing names three causes, and the SG&A breakdown confirms their size. Freight and packing costs rose 18.4% to ¥5,685 million as higher sales meant more shipments. Salaries and bonuses rose 16.6% to ¥8,381 million, reflecting a base-pay revision and a higher housing allowance introduced in July 2025. Depreciation within SG&A rose 24.0% to ¥3,406 million after the new core IT system, Paradise 4, went live in January and the new distribution centre Planet Aichi began operating in May. Those three lines together added ¥2,734 million of the ¥2,915 million SG&A increase.
Planet Aichi is the company's 29th distribution centre, with a floor area of 26,971 tsubo (89,162 square metres). The company says it is expected eventually to hold more than one million stock items and to ship roughly ¥100,000 million of goods a year. Because EBITDA adds depreciation back, it grew 9.0%, faster than operating profit.
Interest costs nearly doubled below the operating line
Ordinary profit grew 4.3%, slower again than operating profit, because interest expense rose 86.6% to ¥487 million from ¥261 million while borrowings increased; total non-operating expenses were ¥534 million against ¥317 million, while non-operating income was ¥268 million against ¥207 million. Extraordinary losses were small in both years — ¥15 million for soil-contamination treatment this half against a ¥99 million impairment loss a year earlier — so pre-tax profit rose 5.0% to ¥12,202 million. After taxes of ¥3,757 million, profit attributable to owners of the parent was ¥8,444 million, up 5.8%. Comprehensive income rose 18.5% to ¥9,014 million, helped by a ¥681 million valuation gain on securities.
All four sales routes grew; Home Center Route slipped to a small loss
The company reports four segments by sales route, and it measures segment profit at the ordinary-profit level. Factory Route, sales to manufacturers and construction-related customers, is by far the largest: revenue ¥116,211 million, up 10.2%, or 65.2% of the total, and segment profit ¥8,372 million, up 4.2%. e-Business Route, sales to online retailers, grew fastest: revenue ¥44,842 million, up 19.4%, and profit ¥4,044 million, up 14.2%. Home Center Route grew revenue 11.7% to ¥15,317 million but, on higher costs, swung to a segment loss of ¥32 million from a profit of ¥165 million. Overseas Route, covering the Thai and Indonesian subsidiaries and export sales, grew revenue 18.3% to ¥1,833 million and profit 33.1% to ¥164 million.
The filing links the growth to stock depth and delivery service: expanded inventory at 29 distribution centres and 30 stock-holding branches, on-site MRO Stocker tool cabinets, a customer pick-up service at 57 locations, and, for e-Business, data links to a database of about 4.17 million items from 3,783 suppliers plus automated I-Pack packing lines at six centres. By product, work supplies rose 20.1% to ¥34,043 million and environmental and safety products 15.2% to ¥36,403 million. The company attributes part of the demand to the Middle East situation, which lifted orders for packing and binding materials and chemical products, and to companies strengthening heatstroke countermeasures.
Borrowing funded the build-out; operating cash flow did not cover investment
Total assets rose 10.1% to ¥339,515 million from December 31, 2025. Buildings rose ¥15,937 million and machinery ¥8,678 million while construction in progress fell ¥22,936 million; cash and deposits rose ¥19,527 million to ¥67,122 million and merchandise inventory ¥6,296 million to ¥74,474 million. On the other side, short-term borrowings doubled to ¥20,000 million and long-term borrowings rose to ¥70,000 million from ¥55,000 million, so with the current portion unchanged at ¥15,000 million total bank borrowing rose from ¥80,000 million to ¥105,000 million. Net assets grew 3.8% to ¥193,320 million and the equity ratio fell from 60.4% to 56.9%.
Operating cash flow was ¥4,599 million against ¥5,080 million a year earlier: pre-tax profit and depreciation were largely offset by a ¥6,329 million increase in inventories, a ¥2,473 million rise in receivables and ¥3,363 million of taxes paid. Investing outflows were ¥8,169 million, mainly ¥7,155 million for property and equipment including Planet Aichi's material-handling equipment. Financing brought in ¥23,057 million — ¥25,000 million of new borrowing less ¥1,941 million of dividends — and cash and cash equivalents ended the half at ¥66,873 million, up ¥19,465 million.
Guidance revised: a stronger first half, a weaker second
TRUSCO Nakayama said first-half revenue, operating profit, ordinary profit and net profit all exceeded its previous forecast, and revised its full-year FY12/2026 guidance to revenue of ¥350,000 million (+9.4%), EBITDA of ¥30,886 million (+8.9%), operating profit of ¥22,580 million (−1.0%), ordinary profit of ¥21,958 million (−2.6%) and net profit of ¥15,127 million (−4.7%), or ¥229.42 per share. The filing does not restate the previous figures. It expects Middle East-related demand to ease in the second half, with results otherwise broadly on plan.
The filing also prints the implied second half, from July to December: revenue of ¥171,795 million (+6.2%) but operating profit of ¥10,097 million (−8.1%), ordinary profit of ¥9,741 million (−10.0%) and net profit of ¥6,683 million (−15.4%). Profit is therefore guided to fall in the second half even as sales keep growing, and the filing does not itemise why. The dividend forecast was not changed: an interim dividend of ¥32.50 (against ¥30.50) will be paid from August 28, 2026, and a year-end ¥28.50 is forecast, for an annual ¥61.00 against ¥60.00.
| Metric | H1 FY12/2026 | H1 FY12/2025 | Change |
|---|---|---|---|
| Revenue (¥ million) | 178,204 | 158,233 | +12.6% |
| Gross profit (¥ million) | 36,907 | 33,334 | +10.7% |
| Gross margin | 20.7% | 21.1% | −0.4 pt |
| SG&A expenses (¥ million) | 24,424 | 21,509 | +13.6% |
| EBITDA (¥ million) | 15,889 | 14,572 | +9.0% |
| Operating profit (¥ million) | 12,483 | 11,825 | +5.6% |
| Operating margin | 7.0% | 7.5% | −0.5 pt |
| Ordinary profit (¥ million) | 12,217 | 11,716 | +4.3% |
| Net profit attrib. to owners of parent (¥ million) | 8,444 | 7,984 | +5.8% |
| EPS (¥) | 128.07 | 121.08 | +5.8% |
| Factory Route — revenue (¥ million) | 116,211 | 105,407 | +10.2% |
| Factory Route — segment profit (¥ million) | 8,372 | 8,037 | +4.2% |
| e-Business Route — revenue (¥ million) | 44,842 | 37,557 | +19.4% |
| e-Business Route — segment profit (¥ million) | 4,044 | 3,541 | +14.2% |
| Home Center Route — revenue (¥ million) | 15,317 | 13,717 | +11.7% |
| Home Center Route — segment profit (¥ million) | −32 | 165 | profit to loss |
| Overseas Route — revenue (¥ million) | 1,833 | 1,550 | +18.3% |
| Overseas Route — segment profit (¥ million) | 164 | 123 | +33.1% |
| Total assets (¥ million) | 339,515 | 308,359 | +10.1% |
| Net assets (¥ million) | 193,320 | 186,252 | +3.8% |
| Equity ratio | 56.9% | 60.4% | −3.5 pt |
| FY12/2026 guidance — revenue (¥ million) | 350,000 | — | +9.4% |
| FY12/2026 guidance — EBITDA (¥ million) | 30,886 | — | +8.9% |
| FY12/2026 guidance — operating profit (¥ million) | 22,580 | — | −1.0% |
| FY12/2026 guidance — ordinary profit (¥ million) | 21,958 | — | −2.6% |
| FY12/2026 guidance — net profit (¥ million) | 15,127 | — | −4.7% |
| FY12/2026 guidance — EPS (¥) | 229.42 | — | — |
| Annual dividend per share (¥) | 61.00 | 60.00 | +1.7% |
JapanStockPulse provides informational content only and does not constitute investment advice. Figures are taken from the company's published earnings short report and may be subject to subsequent revision.