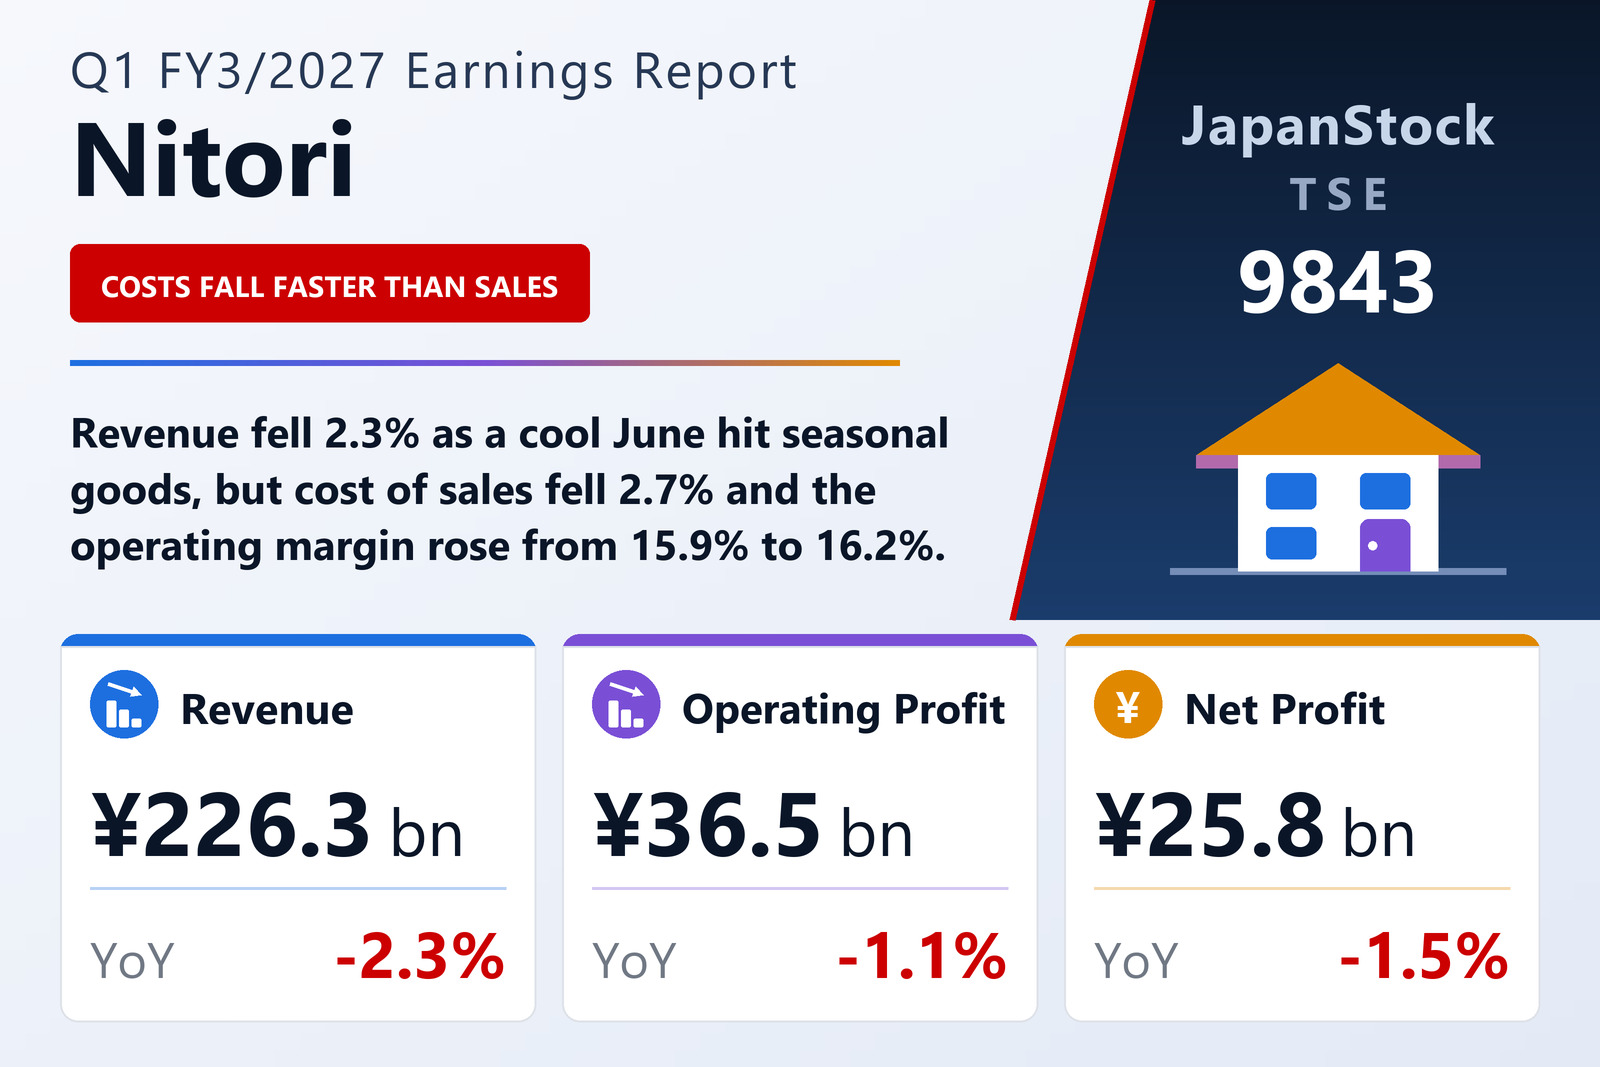
Revenue fell 2.3%, but the margin moved up
Nitori Holdings Co., Ltd. (TSE: 9843), the group that develops, manufactures and sells furniture and interior goods under the Nitori name and runs the Shimachu home-centre chain, published consolidated results for the first quarter of the fiscal year ending March 31, 2027 — the three months from April 1 to June 30, 2026 — on August 7, 2026 under IFRS. Revenue fell 2.3% to ¥226,259 million, operating profit 1.1% to ¥36,545 million and profit attributable to owners of the parent 1.5% to ¥25,757 million, for basic earnings of ¥45.58 per share against ¥46.29. Pre-tax profit edged up 0.1% to ¥37,183 million. Both quarters cover April to June, so the comparison is like-for-like, and the filing prints its own year-on-year rates. The shares are listed on the Tokyo and Sapporo stock exchanges.
The arithmetic explains why profit fell less than sales. Cost of sales dropped 2.7% to ¥104,924 million, a little faster than revenue, so gross profit slipped only 2.0% to ¥121,334 million and the gross margin edged up from 53.4% to 53.6%. Selling, general and administrative expenses fell 1.8% to ¥85,914 million — slower than revenue, so their share of sales rose slightly. The rest of the gap was closed below gross profit: the share of profit of equity-method investees rose to ¥1,255 million from ¥976 million, other income to ¥930 million from ¥726 million, and other expenses were broadly flat at ¥1,061 million. Operating profit ended only ¥397 million lower, and the operating margin widened from 15.9% to 16.2%.
A steady spring, then a cool June
The filing describes a difficult market for furniture and interior goods: a slow recovery in consumer confidence has weakened appetite for durable goods, while competition across formats, rising labour costs and persistently high raw-material and logistics costs have added pressure. In the Nitori business, sales and customer numbers held up through May, helped by new products and a Golden Week redecorating campaign, but June temperatures ran below recent years and sales of seasonal goods stalled. For the quarter, domestic existing stores served 97.5% of the prior year's customers and took 96.7% of its sales.
The company attributes the fall in SG&A mainly to lower logistics costs, from right-sizing its delivery set-up, and to the absence of the equipment purchases booked a year earlier when a new distribution centre started up. On advertising, it has cut back on television and print in favour of social media and YouTube advertising.
Nitori business edges down; Shimachu lifts profit on a smaller floor
Nitori business revenue, including intersegment sales, fell 1.1% to ¥203,142 million (external revenue 1.2% to ¥199,588 million), and segment profit fell 1.6% to ¥33,415 million. Store sales were ¥166,854 million against ¥169,586 million, and mail-order sales ¥24,302 million against ¥24,659 million. In Japan the segment opened 10 Nitori and 10 Deco Home stores; overseas it opened six — three in Taiwan, two in mainland China and one in Thailand.
Shimachu business revenue fell 8.8% to ¥27,258 million (external revenue 10.3% to ¥26,670 million), yet segment profit rose 5.3% to ¥3,150 million. The filing ties the higher profit to a deliberate reshaping: sales floor was resized according to the profitability of each product category, freed-up space in some stores was used for Nitori stores or let to outside tenants, and each facility's profit structure was reviewed. Private-brand development, including a new mid-to-upper-priced furniture series, improved the gross margin. The group ran 1,084 stores at June 30, against 1,069 at March 31, after 26 openings and 11 closures.
Finance income lifted pre-tax profit; a higher tax charge took it back
Finance income rose to ¥1,729 million from ¥1,116 million while finance costs rose to ¥1,091 million from ¥927 million, which is why pre-tax profit edged up 0.1% even as operating profit fell. Income tax expense rose 4.1% to ¥11,425 million, taking the tax charge to 30.7% of pre-tax profit from 29.6%, and profit attributable to owners fell 1.5%. Comprehensive income rose 30.2% to ¥28,537 million: foreign-currency translation differences contributed a gain of ¥2,198 million against a loss of ¥2,089 million a year earlier, and cash-flow hedges a loss of only ¥33 million against ¥3,843 million.
Balance sheet: receivables and payables unwound
Total assets fell by ¥15,021 million from March 31 to ¥1,556,262 million, mainly because trade and other receivables fell by ¥18,175 million. Liabilities fell by ¥34,858 million to ¥547,855 million, led by trade and other payables (down ¥15,435 million), income taxes payable (down ¥8,257 million) and contract liabilities (down ¥7,889 million); current borrowings were cut to ¥140,000 million from ¥150,000 million. Equity rose by ¥19,836 million to ¥1,008,407 million, mainly through a ¥17,055 million rise in retained earnings, and the ratio of equity attributable to owners of the parent rose to 64.8% from 62.9%. Cash and cash equivalents stood at ¥153,523 million. No quarterly cash-flow statement was prepared; depreciation and amortisation came to ¥17,413 million against ¥17,064 million.
Guidance and dividend forecast unchanged
Nitori left unchanged the forecasts it published on May 14, 2026. For the first half it expects revenue of ¥457,400 million (up 4.2%) and operating profit of ¥60,200 million (up 0.6%); for the full year, revenue of ¥957,000 million (up 4.9%), operating profit of ¥130,300 million (up 3.8%), pre-tax profit of ¥131,000 million (up 2.9%) and profit attributable to owners of ¥91,000 million (up 1.9%), or ¥161.05 per share. The first quarter delivered 23.6% of the full-year revenue target and 28.0% of the operating-profit target; meeting the first-half plan implies second-quarter revenue of ¥231,141 million and operating profit of ¥23,655 million. The filing does not say what it expects to turn revenue back to growth.
The dividend forecast is also unchanged at ¥16.00 at the interim and ¥16.00 at the year-end, ¥32.00 for the year. Comparison with the prior year is complicated by a five-for-one share split effective October 1, 2025: the FY3/2026 interim dividend of ¥77.00 is stated before the split and the year-end dividend of ¥15.40 after it, so the filing gives no annual total for that year. Per-share earnings for both periods are calculated as if the split had taken place at the start of the prior fiscal year.
| Metric | Q1 FY3/2027 | Q1 FY3/2026 | Change |
|---|---|---|---|
| Revenue (¥ million) | 226,259 | 231,694 | −2.3% |
| Gross profit (¥ million) | 121,334 | 123,805 | −2.0% |
| Gross margin | 53.6% | 53.4% | +0.2 pt |
| SG&A expenses (¥ million) | 85,914 | 87,486 | −1.8% |
| Operating profit (¥ million) | 36,545 | 36,942 | −1.1% |
| Operating margin | 16.2% | 15.9% | +0.3 pt |
| Pre-tax profit (¥ million) | 37,183 | 37,132 | +0.1% |
| Net profit attrib. to owners of parent (¥ million) | 25,757 | 26,154 | −1.5% |
| EPS (¥) | 45.58 | 46.29 | −1.5% |
| Comprehensive income (¥ million) | 28,537 | 21,922 | +30.2% |
| Nitori Business — revenue (¥ million) | 203,142 | 205,396 | −1.1% |
| Nitori Business — segment profit (¥ million) | 33,415 | 33,950 | −1.6% |
| Shimachu Business — revenue (¥ million) | 27,258 | 29,895 | −8.8% |
| Shimachu Business — segment profit (¥ million) | 3,150 | 2,990 | +5.3% |
| Total assets (¥ million) | 1,556,262 | 1,571,284 | −1.0% |
| Cash and cash equivalents (¥ million) | 153,523 | 145,010 | +5.9% |
| Equity attrib. to owners of parent (¥ million) | 1,008,394 | 988,559 | +2.0% |
| Equity ratio | 64.8% | 62.9% | +1.9 pt |
| FY3/2027 guidance — revenue (¥ million) | 957,000 | — | +4.9% |
| FY3/2027 guidance — operating profit (¥ million) | 130,300 | — | +3.8% |
| FY3/2027 guidance — pre-tax profit (¥ million) | 131,000 | — | +2.9% |
| FY3/2027 guidance — net profit (¥ million) | 91,000 | — | +1.9% |
| FY3/2027 guidance — EPS (¥) | 161.05 | — | — |
| Annual dividend per share (¥) | 32.00 | — | — |
JapanStockPulse provides informational content only and does not constitute investment advice. Figures are taken from the company's published earnings short report and may be subject to subsequent revision.