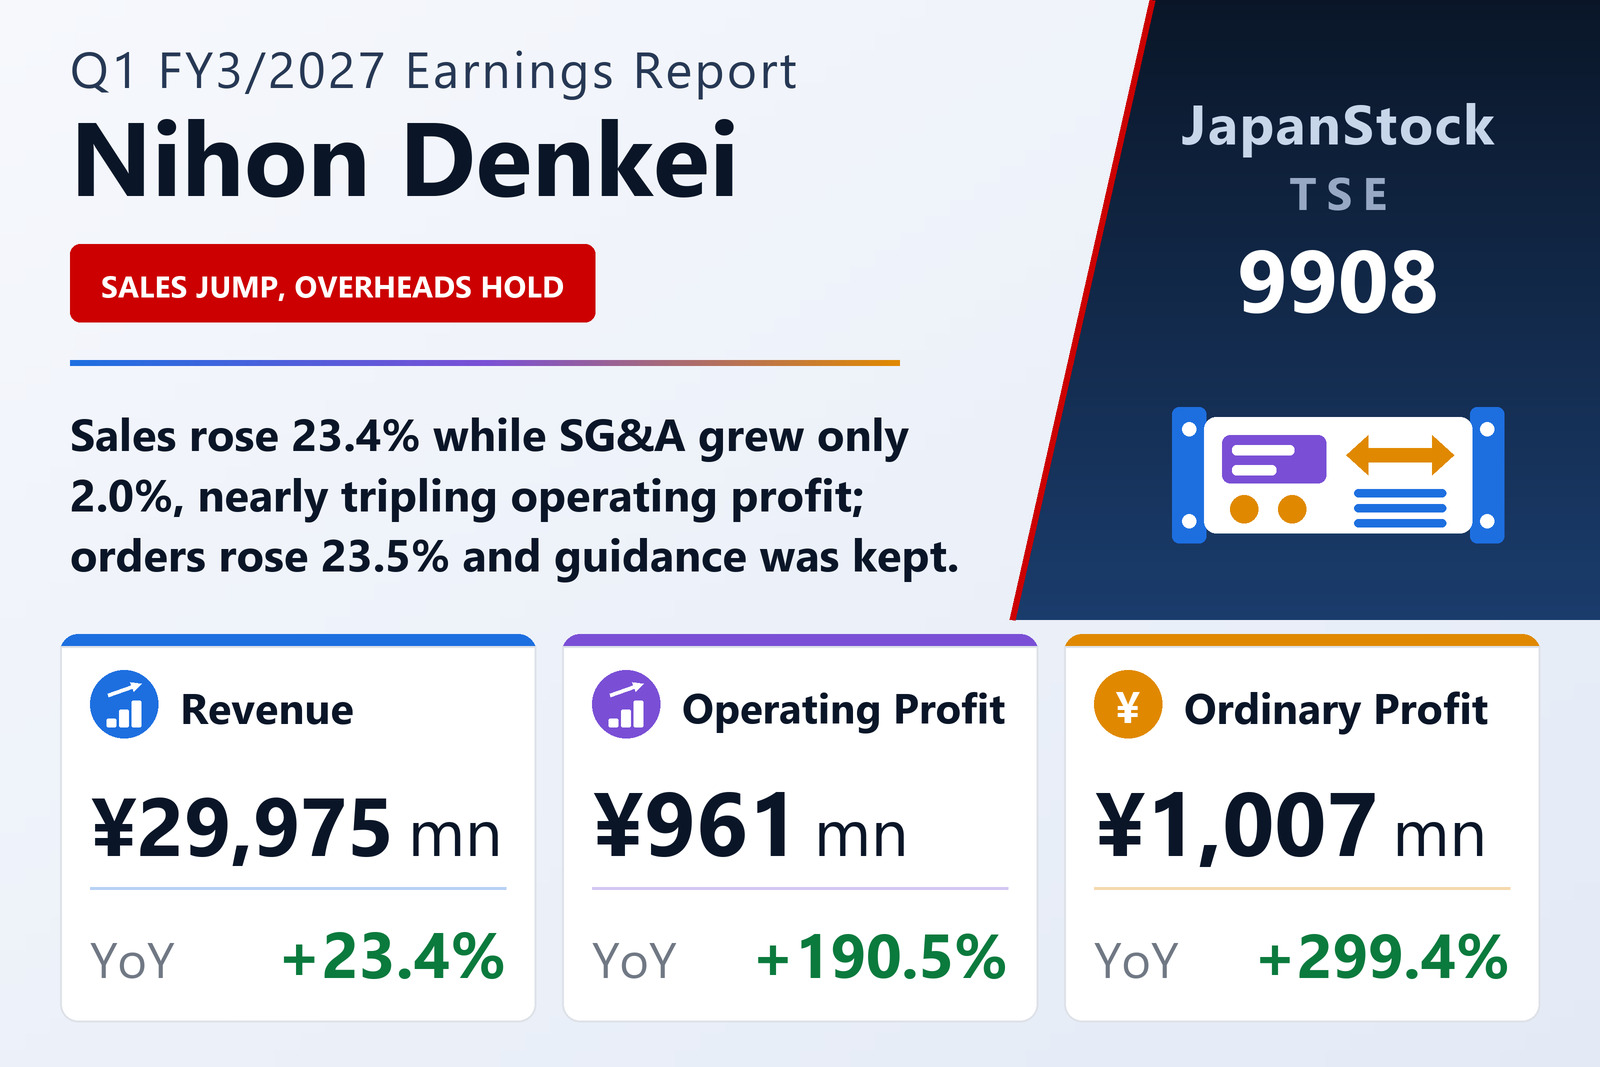
Sales up 23.4%, overheads up 2.0% — the operating line took the difference
Nihon Denkei Co., Ltd. (TSE: 9908), a trading company in electronic measuring instruments, power supplies and environmental test equipment, published consolidated results for the first quarter of the fiscal year ending March 2027 — the three months from April 1 to June 30, 2026 — on August 7, 2026, under Japanese GAAP. Net sales rose 23.4% to ¥29,975 million, operating profit 190.5% to ¥961 million, ordinary profit 299.4% to ¥1,007 million and profit attributable to owners of the parent to ¥552 million from ¥35 million, a jump the filing does not express as a percentage. Earnings per share were ¥48.67 against ¥3.10. The filing names the Tokyo Stock Exchange as the listing venue.
The result was not made at the gross line. Cost of sales rose 24.0% to ¥25,816 million, slightly faster than sales, so gross profit rose 20.0% to ¥4,159 million and the gross margin slipped from 14.3% to 13.9% — a narrowing the company itself calls small. It was made below that line: selling, general and administrative expenses rose just 2.0%, to ¥3,197 million from ¥3,135 million, even though the company says it is actively investing in its people through pay rises and additional staff. Gross profit grew by ¥692 million and SG&A by only ¥61 million, leaving operating profit ¥630 million higher and the operating margin at 3.2% against 1.4%. The filing attributes the sales growth to orders captured in growth areas: capital and R&D spending tied to autos, AI- and semiconductor-related demand, and investment linked to higher defence budgets.
Below the operating line, a currency swing and a compensation receipt
Non-operating items added a net ¥45 million, against a net charge of ¥78 million a year earlier. The weaker yen produced a foreign-exchange gain of ¥27 million, against a ¥58 million foreign-exchange loss in the prior-year quarter, and the company booked ¥40 million of compensation received, an item absent a year earlier. Interest expense nearly doubled, to ¥81 million from ¥43 million. Ordinary profit therefore reached ¥1,007 million, up ¥755 million. Extraordinary items were negligible, pre-tax profit was ¥1,008 million, and income taxes of ¥435 million — about 43% of pre-tax profit — left quarterly profit at ¥572 million, of which ¥19 million was attributable to non-controlling interests.
Comprehensive income was ¥1,143 million against a loss of ¥354 million a year earlier. Unrealised gains on securities contributed ¥370 million and foreign-currency translation ¥200 million, whereas in the prior-year quarter translation alone had subtracted ¥449 million.
Japan does most of the work; China's profit fell
The three reporting segments are geographic, defined by the selling entity, so sales from Japan to overseas customers are booked in Japan; the figures below include intersegment transactions. Japan rose 22.4% to ¥23,778 million, with segment profit of ¥1,304 million against ¥705 million, up 84.8%; the filing points to active investment by its main customers in next-generation vehicles, ADAS and autonomous-driving development, AI and semiconductors, defence and high-speed, high-capacity communications. China grew 18.3% to ¥4,829 million, but segment profit fell to ¥42 million from ¥59 million: the two Shanghai sales subsidiaries secured solid earnings on stronger order-taking despite a lingering slowdown, while the Shanghai subsidiary that runs a contract testing laboratory struggled. Other regions rose 7.2% to ¥2,352 million, with profit of ¥188 million against ¥138 million; sales subsidiaries in Thailand and Indonesia were firm, those in South Korea and Vietnam earned less but held a certain level, and the U.S. sales subsidiary struggled.
The product breakdown shows where the growth came from. Electronic measuring instruments, the core line, rose 59.0% to ¥13,145 million, and environmental, evaluation and test equipment 59.4% to ¥2,666 million; PCs and related products rose 31.9% to ¥2,230 million and electronic and mechanical components 15.8% to ¥5,119 million. Against that, manufacturing, processing and inspection equipment fell 34.0% to ¥2,042 million, image measurement and surface observation 9.7% to ¥1,097 million, and other products 6.5% to ¥3,673 million. Overseas sales rose to ¥7,777 million from ¥6,605 million, but their share of consolidated sales eased from 27.2% to 25.9%.
Orders ran ahead of sales, and the backlog grew by a third
Orders received rose 23.5% to ¥39,294 million, exceeding the quarter's sales by ¥9,319 million, so the order backlog stood at ¥54,204 million at June 30, 2026 — 32.7% above the ¥40,861 million of a year earlier and up from ¥44,885 million at March 31, 2026. The quarter opens the final year of the company's medium-term plan, INNOVATION2030 Ver.2.0, under which it is pursuing stable growth in its electronic-measuring-instrument core business, stronger system proposals, expansion into growth markets and global expansion.
A smaller balance sheet as receivables were collected and payables paid
Total assets fell ¥3,000 million from March 31, 2026, to ¥75,821 million. Notes and accounts receivable fell ¥8,604 million, partly offset by electronically recorded receivables up ¥3,513 million and merchandise and finished goods up ¥2,185 million; cash and deposits declined to ¥6,509 million from ¥8,193 million. On the other side, notes and accounts payable fell ¥7,921 million while short-term borrowings rose ¥4,485 million to ¥19,648 million, and long-term borrowings fell ¥553 million. Net assets rose ¥403 million to ¥33,845 million, chiefly because accumulated other comprehensive income rose ¥564 million, and with total assets smaller the equity ratio improved from 41.6% to 43.9%. The company did not prepare a quarterly cash-flow statement; depreciation for the quarter was ¥122 million.
Guidance unchanged, with the first quarter at half the first-half plan
Nihon Denkei left unchanged the forecasts it published on May 13, 2026 with its FY3/2026 results. For the six months to September 30, 2026 it expects net sales of ¥60,000 million (+14.7%), operating profit of ¥2,050 million (+64.4%), ordinary profit of ¥2,050 million (+68.0%) and profit attributable to owners of ¥1,250 million (+67.0%). For the full year it guides to net sales of ¥136,000 million (+2.1%), operating profit of ¥5,200 million (+4.6%), ordinary profit of ¥5,200 million (+2.4%) and profit attributable to owners of ¥3,500 million (−4.1%), or ¥308.29 per share. The first quarter delivered 50.0% of the first-half sales plan, 46.9% of its operating-profit plan and 49.1% of its ordinary-profit plan; against the full year it covered 22.0% of sales and 18.5% of operating profit. The company cautions that inflation concerns, political conditions and geopolitical risk, including in the Middle East, keep uncertainty high and that its results could vary significantly.
The dividend forecast was also unchanged: ¥54.00 at the interim and ¥55.00 at the year-end, an annual ¥109.00 against ¥97.00 for FY3/2026 (¥43.00 interim and ¥54.00 year-end), up 12.4%. On the guided ¥308.29 of earnings per share, that is a payout of about 35%.
| Metric | Q1 FY3/2027 | Q1 FY3/2026 | Change |
|---|---|---|---|
| Net sales (¥ million) | 29,975 | 24,293 | +23.4% |
| Gross profit (¥ million) | 4,159 | 3,466 | +20.0% |
| Gross margin | 13.9% | 14.3% | −0.4 pt |
| SG&A expenses (¥ million) | 3,197 | 3,135 | +2.0% |
| Operating profit (¥ million) | 961 | 331 | +190.5% |
| Operating margin | 3.2% | 1.4% | +1.8 pt |
| Ordinary profit (¥ million) | 1,007 | 252 | +299.4% |
| Net profit attrib. to owners of parent (¥ million) | 552 | 35 | n.m. |
| Comprehensive income (¥ million) | 1,143 | −354 | n.m. |
| EPS (¥) | 48.67 | 3.10 | n.m. |
| Orders received (¥ million) | 39,294 | 31,819 | +23.5% |
| Order backlog (¥ million) | 54,204 | 40,861 | +32.7% |
| Japan — revenue (¥ million) | 23,778 | 19,433 | +22.4% |
| Japan — segment profit (¥ million) | 1,304 | 705 | +84.8% |
| China — revenue (¥ million) | 4,829 | 4,080 | +18.3% |
| China — segment profit (¥ million) | 42 | 59 | −28.8% |
| Other regions — revenue (¥ million) | 2,352 | 2,194 | +7.2% |
| Other regions — segment profit (¥ million) | 188 | 138 | +36.7% |
| Total assets (¥ million) | 75,821 | 78,822 | −3.8% |
| Net assets (¥ million) | 33,845 | 33,441 | +1.2% |
| Equity ratio | 43.9% | 41.6% | +2.3 pt |
| FY3/2027 guidance — revenue (¥ million) | 136,000 | — | +2.1% |
| FY3/2027 guidance — operating profit (¥ million) | 5,200 | — | +4.6% |
| FY3/2027 guidance — ordinary profit (¥ million) | 5,200 | — | +2.4% |
| FY3/2027 guidance — net profit (¥ million) | 3,500 | — | −4.1% |
| FY3/2027 guidance — EPS (¥) | 308.29 | — | n.m. |
| Annual dividend per share (¥) | 109.00 | 97.00 | +12.4% |
JapanStockPulse provides informational content only and does not constitute investment advice. Figures are taken from the company's published earnings short report and may be subject to subsequent revision.