Kozo Keikaku Engineering Holdings Inc. (TSE: 208A) published its full-year consolidated earnings report for the financial year ended June 30, 2026 on August 10. This is a kessan tanshin covering the complete twelve months from July 1, 2025 to June 30, 2026 under Japanese GAAP — not a quarterly statement — and it is accompanied by the group's first formal guidance for the year to June 2027. The holding company sits above Kozo Keikaku Engineering Inc., the structural-analysis and simulation house widely known by the initials KKE, and it reports in two segments: Engineering Consulting and Products Services.
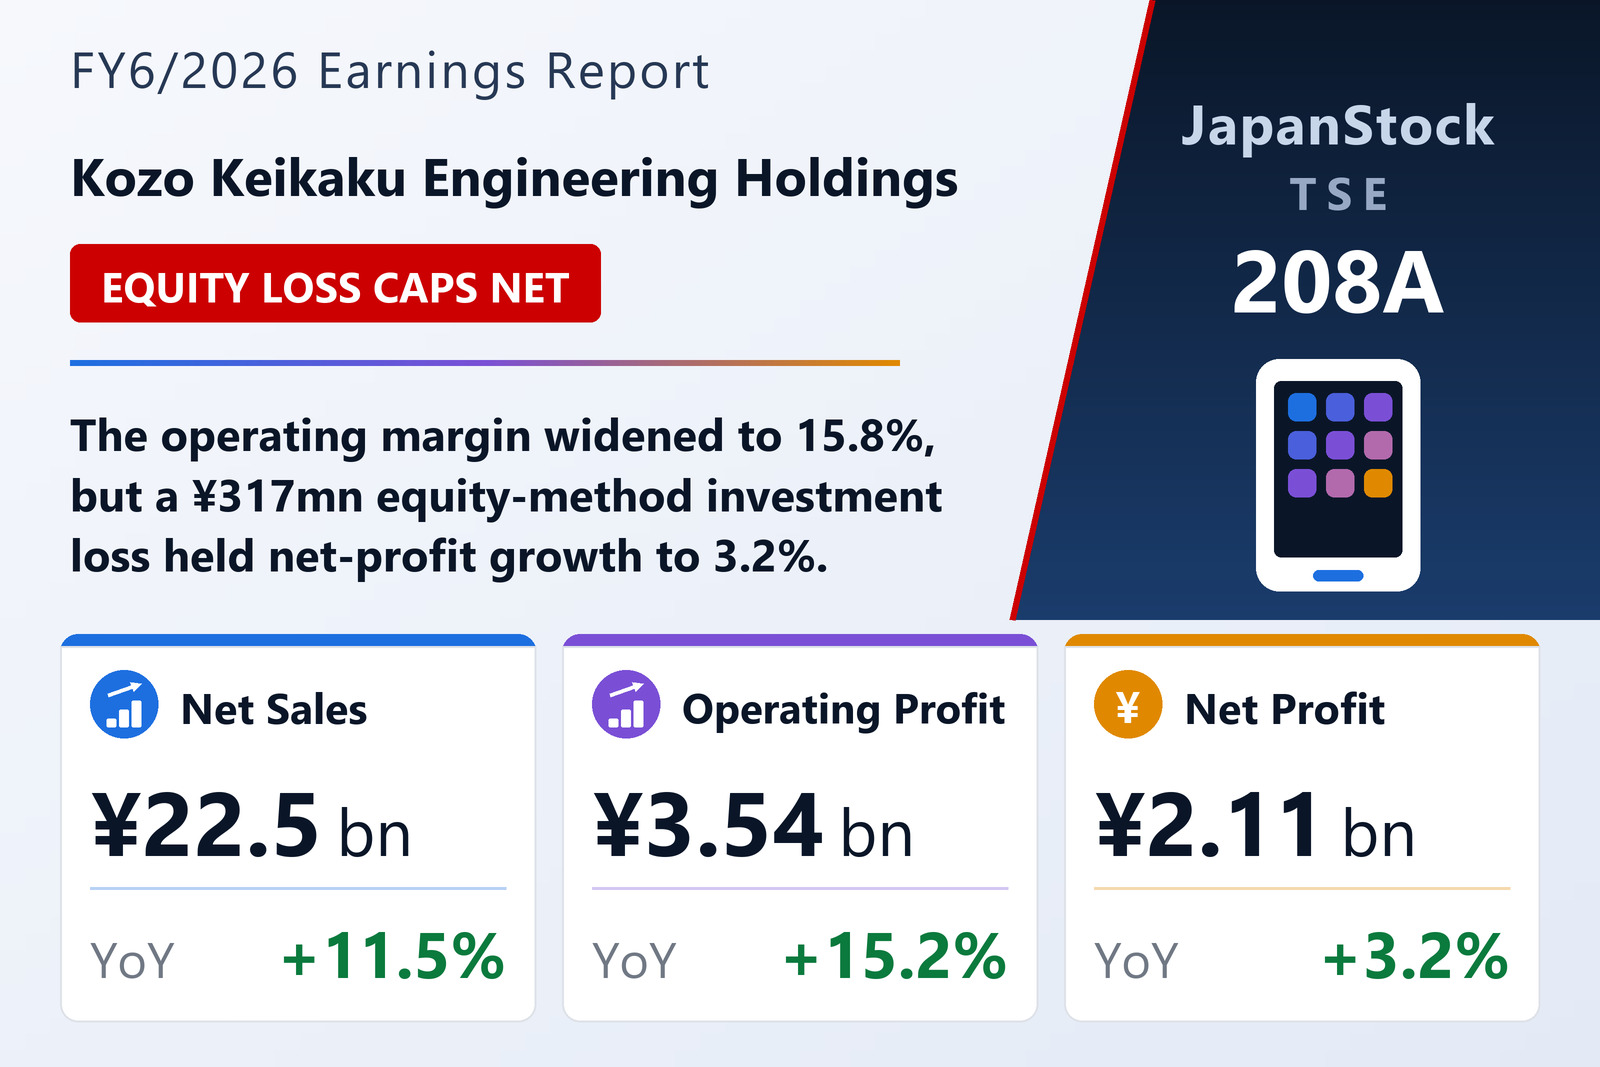
Net sales rose 11.5% to ¥22,453 million from ¥20,137 million, operating profit rose 15.2% to ¥3,540 million, ordinary profit rose 4.9% to ¥3,196 million and net income attributable to owners of the parent rose 3.2% to ¥2,114 million. Earnings per share came to ¥200.34 against ¥192.98. Comprehensive income, which captures valuation items routed outside the income statement, jumped 30.0% to ¥2,698 million on gains in the available-for-sale securities portfolio and a favourable remeasurement of retirement benefits. Return on equity eased to 19.6% from 21.2% — not because profit fell but because the equity base grew far faster than earnings did.
The volume story sits in the order book. Orders received climbed 10.2% to ¥23,002 million and the year-end order backlog rose 6.4% to ¥9,137 million from ¥8,587 million, meaning the group entered FY6/2027 with more contracted work in hand than it began the year with. Management attributed the result to a rich backlog carried over from the prior year, steady completion of projects won during the year, and continued expansion of the cloud-service businesses.
Engineering Consulting supplies the volume — at a deliberately lower gross margin
Engineering Consulting, the larger of the two reporting segments, covers structural design and structural analysis for high-rise and large-scale buildings, seismic and wind-environment assessment, disaster-risk evaluation, CAD/BIM system development for the housing and construction sector, decision-support consulting including social simulation and optimisation, telecom and electromagnetic-propagation simulation, and fluid and powder simulation for manufacturers. Segment sales rose 11.1% to ¥13,303 million, orders received rose 7.4% to ¥13,697 million and the segment's own backlog rose 6.2% to ¥6,700 million from ¥6,306 million. Segment profit — measured on an operating-profit basis — rose 6.2% to ¥5,254 million.
The interesting line is gross profit, which advanced only 6.1% to ¥7,723 million, well behind the 11.1% sales gain. The segment's gross margin therefore fell to 58.1% from 60.8%. That was a choice rather than a squeeze: the company states plainly that it carried out further distribution of the gains to its professional staff as project delivery expanded. It also raised its central management metric this year — total value added, defined as total personnel cost plus operating profit — to a medium-to-long-term growth target of 8% a year, up from the previous 5–7%, explicitly in response to the inflationary environment. In a knowledge-intensive consultancy where the cost of goods sold is largely engineers' time, paying that target out shows up as gross-margin compression at the same time as it shows up as revenue growth.
Products Services: cloud ARR up 20% as RemoteLOCK and NavVis scale
Products Services, which resells and supports CAE, thermo-fluid, particle-method and powder-analysis tools for manufacturers, structural and geotechnical analysis for construction, radio-propagation analysis for telecoms, plus a growing bench of subscription platforms, was the faster grower. Segment sales rose 13.5% to ¥8,619 million, orders received rose 15.5% to ¥8,749 million — the strongest order growth anywhere in the group — and segment profit rose 16.3% to ¥1,589 million. Gross profit rose 12.8% to ¥3,439 million.
Within it, the recurring-revenue engine is now material: total annual recurring revenue across the group's cloud services reached ¥4,218 million, up 20.4% year on year. Management singled out two products as the drivers — RemoteLOCK, the cloud-based access-control platform, and NavVis, the indoor digitisation and 3D site-capture platform — both of which grew at high rates with continuously improving margins. That improvement was offset at the segment level by upfront spending on launching new cloud services and on new products in the packaged-software business, so the segment's gross margin finished essentially flat at 39.9% against 40.1%. The much smaller "Other" category, mainly staffing services, shrank: sales fell 7.2% to ¥529 million and its profit contribution fell 33.0% to ¥124 million.
Why ordinary and net profit badly lagged the operating line
The gap between a 15.2% operating-profit gain and a 3.2% net-income gain is almost entirely one item. Ordinary profit came in ¥345 million below operating profit, against a gap of just ¥27 million a year earlier, because the group booked an equity-method investment loss of ¥317 million in non-operating expenses versus only ¥33 million in FY6/2025 — a ¥284 million year-on-year deterioration that the company flagged alongside a separate news release issued the same day. Below that, an extraordinary loss of ¥20 million on retirement of fixed assets (FY6/2025: ¥31 million) left pre-tax profit up 5.3% at ¥3,176 million; income taxes of ¥1,030 million represented an effective rate of 32.4% against 31.0%, and ¥32 million went to non-controlling interests.
Below the gross-profit line the picture is much healthier. Selling, general and administrative expenses rose only 4.1% to ¥7,746 million against 11.5% sales growth, which is what turned a 7.3% consolidated gross-profit gain into a 15.2% operating-profit gain and lifted the operating margin to 15.8% from 15.3%. Unallocated corporate costs held almost perfectly flat at ¥3,426 million against ¥3,424 million, so essentially all of the incremental gross profit dropped through. Depreciation was steady at ¥377 million.
Long-term debt nearly halved; equity ratio jumps past 50%
Total assets edged up 1.9% to ¥22,495 million. Current assets were near-static at ¥9,492 million (+0.5%) as a ¥692 million increase in advance payments and a ¥151 million increase in trade receivables were largely offset by an ¥814 million drawdown of cash and deposits; non-current assets rose 3.0% to ¥13,003 million on a ¥494 million increase in investment securities.
The balance-sheet news is on the right-hand side. Current liabilities rose 14.5% to ¥7,826 million, mainly on a ¥379 million rise in accrued expenses and ¥164 million in accounts payable, but non-current liabilities fell 38.6% to ¥3,109 million as long-term borrowings were cut by ¥1,264 million to ¥1,535 million and the retirement benefit liability fell ¥761 million. Total liabilities finished at ¥10,935 million. Net assets rose 13.7% to ¥11,559 million on a ¥1,024 million increase in retained earnings, pushing the equity ratio to 50.9% from 45.7% and book value per share to ¥1,087.63 from ¥955.85. On a market-value basis the equity ratio rose to 131.0% from 118.8%.
Cash flow reflected that deleveraging rather than any weakness in trading. Operating cash flow of ¥2,272 million (FY6/2025: ¥3,320 million) came from pre-tax profit of ¥3,176 million, ¥379 million of accrued expenses and ¥377 million of depreciation, against ¥1,275 million of income taxes paid and a ¥692 million build in advance payments. Investing outflows shrank sharply to ¥679 million from ¥2,273 million, comprising ¥329 million of investment-securities purchases and ¥237 million of property and equipment. Financing consumed ¥2,426 million against a ¥57 million inflow a year earlier: ¥1,145 million of long-term debt repayment, ¥1,083 million of dividends and ¥564 million of treasury-share purchases, partly funded by ¥379 million from disposal of treasury shares. Cash and equivalents ended the year at ¥3,428 million against ¥4,243 million. Interest coverage fell to 41.2 times from 94.3 times on the lower operating cash flow, while the debt-to-cash-flow ratio held at 1.0 years.
FY6/2027 guidance, a ¥110 dividend and a ¥500 million buyback
For the year to June 2027 the company guides to net sales of ¥24,380 million (+8.6%), operating profit of ¥3,850 million (+8.7%), ordinary profit of ¥3,790 million (+18.6%) and net income attributable to owners of the parent of ¥2,550 million (+20.6%), for forecast EPS of ¥231.81. The outsized growth rates at the ordinary and net lines are the flip side of this year's equity-method drag: guidance assumes that hit does not repeat at anything like the same scale, so the below-the-operating-line comparison flatters.
On distributions, FY6/2026 quarterly dividends of ¥15.00, ¥20.00 and ¥20.00 were followed by a year-end payment of ¥47.00 — an ordinary ¥35.00 plus a special ¥12.00 — for an annual total of ¥102.00, ¥1,111 million in aggregate, a consolidated payout ratio of 50.9% and a dividend-on-net-assets ratio of 10.0%. On a split-adjusted basis the comparable FY6/2025 figure was ¥90.00 (¥983 million paid, 46.6% payout), the company having executed a 2-for-1 share split on March 1, 2025 that makes the raw prior-year quarterly figures non-additive. For FY6/2027 the forecast annual dividend rises to ¥110.00 for a 47.5% payout ratio; the company intends to keep paying quarterly but has not yet fixed the individual quarterly amounts. Dividend-on-equity rose to 9.8% from 9.4%.
As a material subsequent event, the board resolved on August 10, 2026 — the same day as these results — to buy back up to 190,000 of its own shares, equal to 1.74% of shares outstanding excluding treasury stock, for a maximum outlay of ¥500 million, to be executed on the Tokyo Stock Exchange including via off-auction ToSTNeT-3 trades between August 17 and December 31, 2026. The stated rationale is flexible capital management and returning part of profits to shareholders. Shares issued stood at 11,000,000 with 469,724 held in treasury at year-end, up from 439,274; the weighted average share count for the year was 10,553,108. There were no changes to the scope of consolidation or to accounting policies during the year, no goodwill amortisation and no segment impairments; domestic customers accounted for more than 90% of sales and no single customer reached 10%. The annual general meeting is scheduled for September 10, 2026, with dividend payments beginning September 11.
| Metric | FY6/2026 | FY6/2025 | YoY |
|---|---|---|---|
| Net sales (¥ million) | 22,453 | 20,137 | +11.5% |
| Gross profit (¥ million) | 11,286 | 10,514 | +7.3% |
| Operating profit (¥ million) | 3,540 | 3,073 | +15.2% |
| Ordinary profit (¥ million) | 3,196 | 3,046 | +4.9% |
| Net income attrib. to owners (¥ million) | 2,114 | 2,048 | +3.2% |
| EPS (¥) | 200.34 | 192.98 | +3.8% |
| Operating margin | 15.8% | 15.3% | +0.5pt |
| ROE | 19.6% | 21.2% | −1.6pt |
| Segment sales: Engineering Consulting (¥ million) | 13,303 | 11,969 | +11.1% |
| Segment sales: Products Services (¥ million) | 8,619 | 7,597 | +13.5% |
| Cloud services ARR (¥ million) | 4,218 | — | +20.4% |
| Orders received (¥ million) | 23,002 | 20,880 | +10.2% |
| Order backlog, year-end (¥ million) | 9,137 | 8,587 | +6.4% |
| Total assets (¥ million) | 22,495 | 22,067 | +1.9% |
| Net assets (¥ million) | 11,559 | 10,168 | +13.7% |
| Equity ratio | 50.9% | 45.7% | +5.2pt |
| Operating cash flow (¥ million) | 2,272 | 3,320 | −31.6% |
| Annual dividend (¥, split-adjusted) | 102.00 | 90.00 | +13.3% |
JapanStockPulse provides informational content only and does not constitute investment advice. Figures are taken from the company's published earnings short report and may be subject to subsequent revision. The company disclosed cloud-services ARR only for FY6/2026 together with its year-on-year growth rate; the prior-year absolute figure was not published.