Franchise fees, not restaurant sales, are where the profit sits
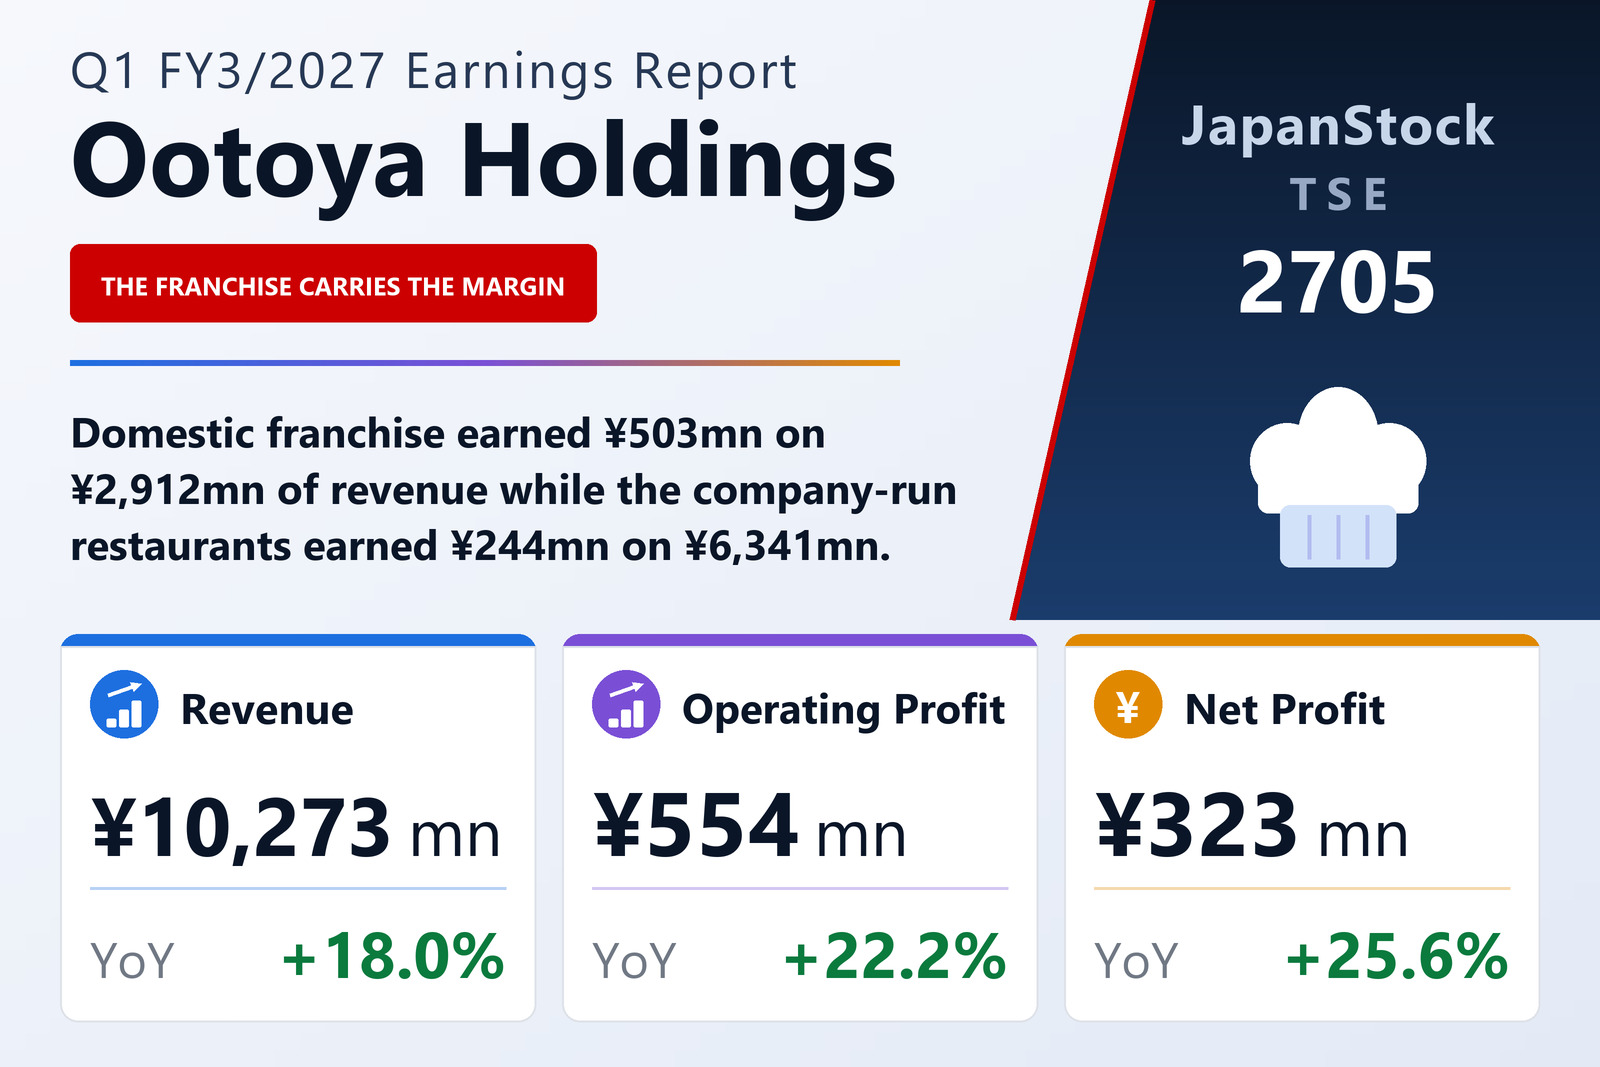
Ootoya Holdings Co., Ltd. (TSE: 2705), which runs the Ootoya Gohandokoro set-meal chain, published consolidated results for the three months to June 30, 2026 on August 10, 2026 under Japanese GAAP. Net sales rose 18.0% to ¥10,273 million, operating profit 22.2% to ¥554 million, ordinary profit 19.4% to ¥564 million and net profit 25.6% to ¥323 million, for earnings per share of ¥44.52 against ¥35.47.
The segment split says where the money is made. Domestic Directly-Operated is much the largest business at ¥6,341 million of revenue, up 18.5%, but it produced only ¥244 million of segment profit, up 16.0%. Domestic Franchise, less than half its size at ¥2,912 million (+23.0%), produced ¥503 million (+20.6%) — more than twice as much profit on well under half the revenue. That is the shape of a franchisor: the company-run restaurants carry the operating cost base, the franchised ones carry the margin.
Both segments were helped by limited-time menus. In the directly-operated business the store count ended the quarter at 153 Ootoya Gohandokoro outlets plus four others; the franchise side opened three new Ootoya Gohandokoro restaurants and converted one company-run outlet to a franchise, reaching 168 operating stores.
Overseas is the one segment going backwards
Overseas Directly-Operated is the exception: revenue fell 2.5% to ¥745 million and the segment loss widened to ¥31 million from ¥26 million. It is a small estate — nine restaurants, four in Hong Kong, four in New York State and one in Thailand — and the company describes limited-time menus in each country plus an influencer collaboration for social-media promotion in the United States.
The overseas franchise network is the mirror image: tiny revenue, real profit. Overseas Franchise grew revenue 19.3% to ¥106 million and profit 58.8% to ¥42 million across 136 stores — 62 in Thailand, 54 in Taiwan, 17 in Indonesia, and one each in Malaysia, Cambodia and the Philippines. Other, an import and sales business for private-brand goods in Thailand, grew revenue 29.1% to ¥167 million and profit 87.7% to ¥36 million.
A lighter balance sheet, and guidance the quarter has already outpaced
Total assets fell 3.4% from the March year-end to ¥11,504 million: current assets down 5.1% to ¥5,528 million on ¥86 million less cash and ¥278 million less in receivables, and fixed assets down 1.7% to ¥5,976 million. Liabilities fell 7.9% to ¥6,891 million, mainly ¥347 million less in accounts payable and ¥227 million less in income taxes payable. Net assets rose 4.3% to ¥4,613 million, lifting the equity ratio to 37.3% from 34.5%.
Guidance is unchanged from the forecast published on May 8, 2026: net sales of ¥38,000 million (+2.7%), operating profit of ¥2,245 million (+4.9%), ordinary profit of ¥2,221 million (+0.7%) and net profit of ¥1,399 million (+13.5%), for earnings per share of ¥192.94. The gap is worth stating: the quarter grew revenue 18.0% against a full-year target of 2.7%, and has already banked 27.0% of the annual revenue target and 24.7% of the operating-profit target. The filing offers no explanation of that gap beyond confirming the forecast stands. The annual dividend is held at ¥20.00, all of it paid at the year end.
| Metric | Q1 FY3/2027 | Q1 FY3/2026 | Change |
|---|---|---|---|
| Net sales (¥ million) | 10,273 | 8,704 | +18.0% |
| Operating profit (¥ million) | 554 | 453 | +22.2% |
| Operating margin | 5.4% | 5.2% | +0.2 pt |
| Ordinary profit (¥ million) | 564 | 472 | +19.4% |
| Net profit (¥ million) | 323 | 257 | +25.6% |
| EPS (¥) | 44.52 | 35.47 | +25.5% |
| Domestic Directly-Operated — revenue (¥ million) | 6,341 | 5,352 | +18.5% |
| Domestic Directly-Operated — segment profit (¥ million) | 244 | 211 | +16.0% |
| Domestic Franchise — revenue (¥ million) | 2,912 | 2,368 | +23.0% |
| Domestic Franchise — segment profit (¥ million) | 503 | 417 | +20.6% |
| Overseas Directly-Operated — revenue (¥ million) | 745 | 764 | −2.5% |
| Overseas Directly-Operated — segment profit (¥ million) | −31 | −26 | loss widened |
| Overseas Franchise — revenue (¥ million) | 106 | 88 | +19.3% |
| Overseas Franchise — segment profit (¥ million) | 42 | 26 | +58.8% |
| Other — revenue (¥ million) | 167 | 129 | +29.1% |
| Other — segment profit (¥ million) | 36 | 19 | +87.7% |
| Total assets (¥ million) | 11,504 | 11,907 | −3.4% |
| Net assets (¥ million) | 4,613 | 4,421 | +4.3% |
| Equity ratio | 37.3% | 34.5% | +2.8 pt |
| FY3/2027 guidance — revenue (¥ million) | 38,000 | — | +2.7% |
| FY3/2027 guidance — operating profit (¥ million) | 2,245 | — | +4.9% |
| FY3/2027 guidance — ordinary profit (¥ million) | 2,221 | — | +0.7% |
| FY3/2027 guidance — net profit (¥ million) | 1,399 | — | +13.5% |
| FY3/2027 guidance — EPS (¥) | 192.94 | — | n.m. |
| Annual dividend per share (¥) | 20.00 | 20.00 | unchanged |
JapanStockPulse provides informational content only and does not constitute investment advice. Figures are taken from the company's published earnings short report and may be subject to subsequent revision.