Exports did the work, and the currency helped
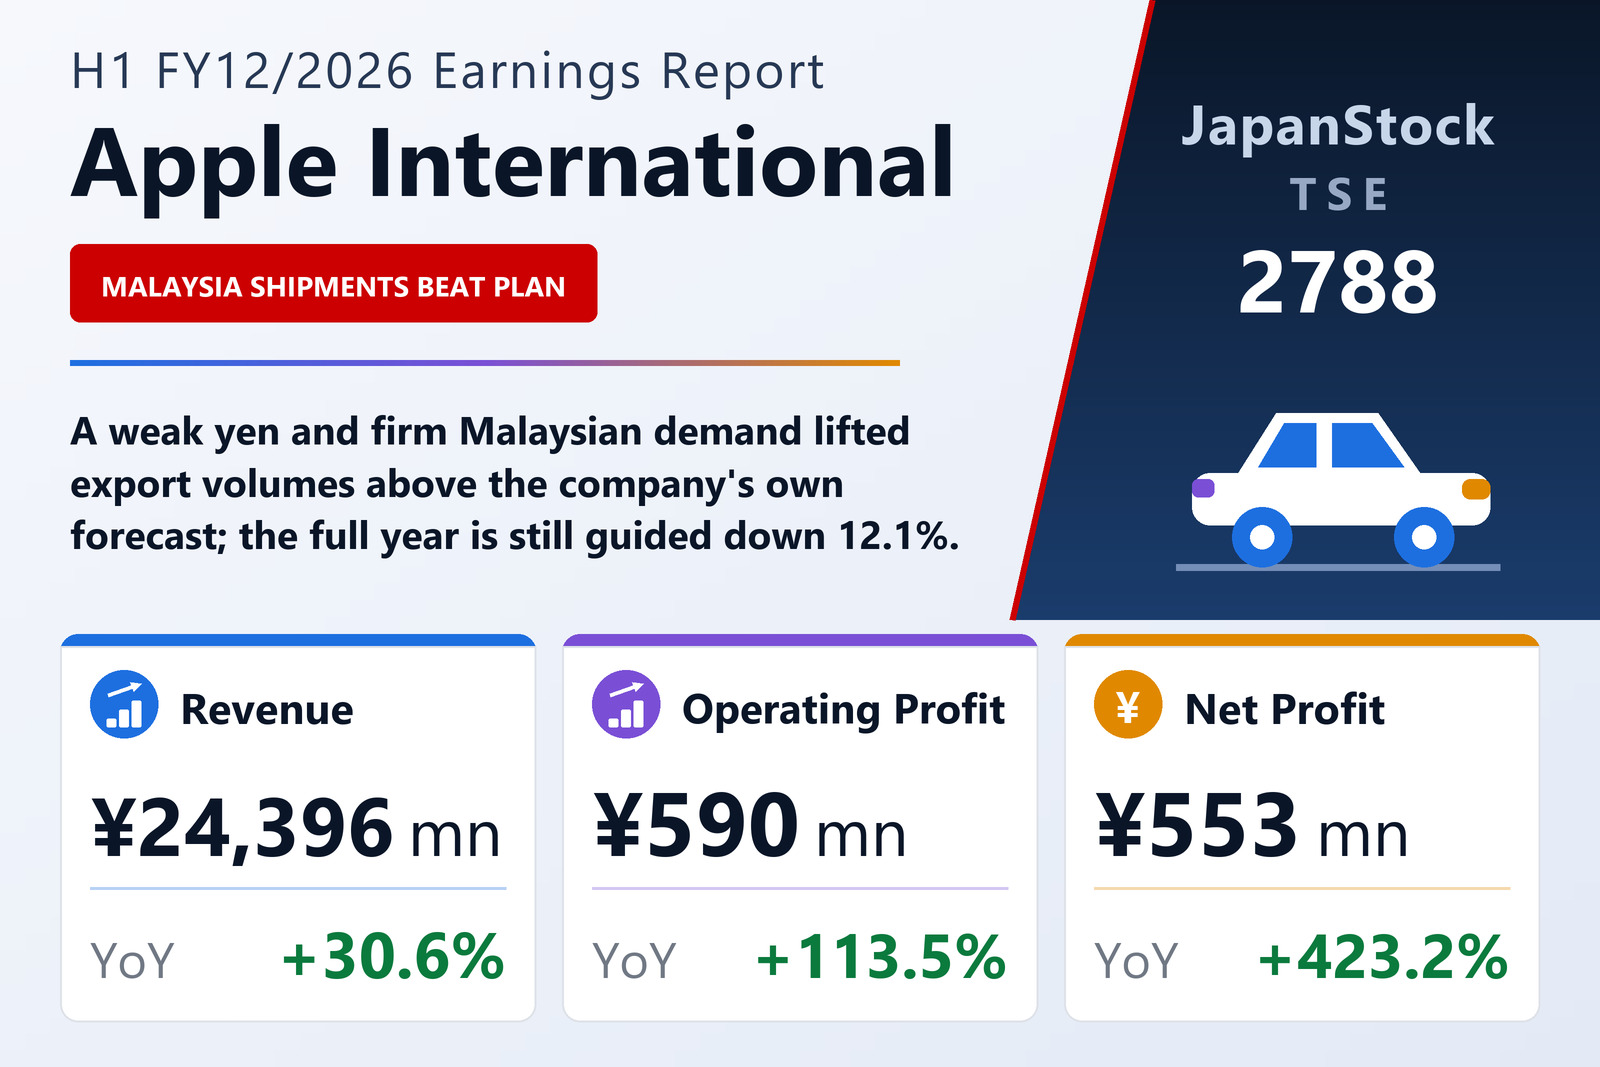
Apple International Co., Ltd. (TSE: 2788), a used-vehicle exporter and dealer, published consolidated results for the six months to June 30, 2026 on August 10, 2026 under Japanese GAAP. Net sales rose 30.6% to ¥24,396 million, operating profit 113.5% to ¥590 million, ordinary profit 255.6% to ¥725 million and net profit 423.2% to ¥553 million, for earnings per share of ¥42.98 against ¥8.24. Note that ordinary profit came in ¥135 million above operating profit, so the step from a 113.5% operating gain to a 255.6% ordinary gain happens in non-operating items rather than in trading.
The company's account of the half is geographic. In the overseas used-car export business, the yen's weakness helped and demand from Malaysia stayed firm, with shipment volumes rising more than initially expected. Shipments to Thailand were soft — the company points to the growth of Chinese electric vehicles clouding the outlook for Japanese-made cars there — but still finished above the prior year. At home, new-vehicle registrations were slightly down and used-car prices settled, so the number of units handled was roughly level with a year earlier.
For context the company cites two industry series: 1,845,809 domestic used-car registrations between January and June 2026, down 0.2%, and 749,284 used-car exports over the same period, up 3.8%. The export line is the one that matters to this business, and it grew.
One segment is the company; the other is a start-up
Automobile Sales-Related is effectively the whole group: revenue up 30.5% to ¥24,317 million and segment profit up 90.0% to ¥650 million. Other — a reuse-distribution business run through subsidiary Apple Auto Network, buying watches and precious-metal branded goods since October 2023 — grew revenue 59.9% to ¥79 million but widened its loss to ¥14 million from ¥10 million. It runs an AI-assisted online system from appraisal through to sale, a dedicated buying store in Tokyo, and buying counters inside the group's own used-car outlets in Tokyo and Mie.
Receivables funded by short-term debt, and a full year guided lower
Total assets rose 10.6% to ¥22,709 million, and the composition matters: accounts receivable rose ¥3,366 million while inventory fell ¥939 million and cash ¥358 million. Liabilities rose ¥1,701 million to ¥11,349 million, funded by ¥1,500 million more short-term borrowings and ¥822 million more deposits received, against ¥477 million less long-term debt. Net assets rose 4.3% to ¥11,360 million, but because assets grew faster the equity ratio fell to 47.1% from 50.0%.
Guidance for the full year to December 2026 is unchanged and points the other way on the top line: net sales of ¥35,856 million (−12.1%), operating profit of ¥769 million (+35.5%), ordinary profit of ¥930 million (+66.5%) and net profit of ¥615 million (−21.8%), for earnings per share of ¥47.96. Two gaps are worth stating plainly. Revenue grew 30.6% in the half against a full-year target of −12.1%, which implies a much weaker second half. And the half has already produced ¥553 million of the ¥615 million full-year net-profit target, leaving about ¥62 million for the remaining six months. The filing does not explain either gap beyond confirming the forecast stands. The annual dividend is held at ¥10.00, all of it at the year end.
| Metric | H1 FY12/2026 | H1 FY12/2025 | Change |
|---|---|---|---|
| Net sales (¥ million) | 24,396 | 18,683 | +30.6% |
| Operating profit (¥ million) | 590 | 276 | +113.5% |
| Operating margin | 2.4% | 1.5% | +0.9 pt |
| Ordinary profit (¥ million) | 725 | 204 | +255.6% |
| Net profit (¥ million) | 553 | 105 | +423.2% |
| EPS (¥) | 42.98 | 8.24 | +421.6% |
| Automobile Sales-Related — revenue (¥ million) | 24,317 | 18,634 | +30.5% |
| Automobile Sales-Related — segment profit (¥ million) | 650 | 342 | +90.0% |
| Other (Reuse Distribution) — revenue (¥ million) | 79 | 50 | +59.9% |
| Other (Reuse Distribution) — segment profit (¥ million) | −14 | −10 | loss widened |
| Total assets (¥ million) | 22,709 | 20,540 | +10.6% |
| Net assets (¥ million) | 11,360 | 10,892 | +4.3% |
| Equity ratio | 47.1% | 50.0% | −2.9 pt |
| FY12/2026 guidance — revenue (¥ million) | 35,856 | — | −12.1% |
| FY12/2026 guidance — operating profit (¥ million) | 769 | — | +35.5% |
| FY12/2026 guidance — ordinary profit (¥ million) | 930 | — | +66.5% |
| FY12/2026 guidance — net profit (¥ million) | 615 | — | −21.8% |
| FY12/2026 guidance — EPS (¥) | 47.96 | — | n.m. |
| Annual dividend per share (¥) | 10.00 | 10.00 | unchanged |
JapanStockPulse provides informational content only and does not constitute investment advice. Figures are taken from the company's published earnings short report and may be subject to subsequent revision.