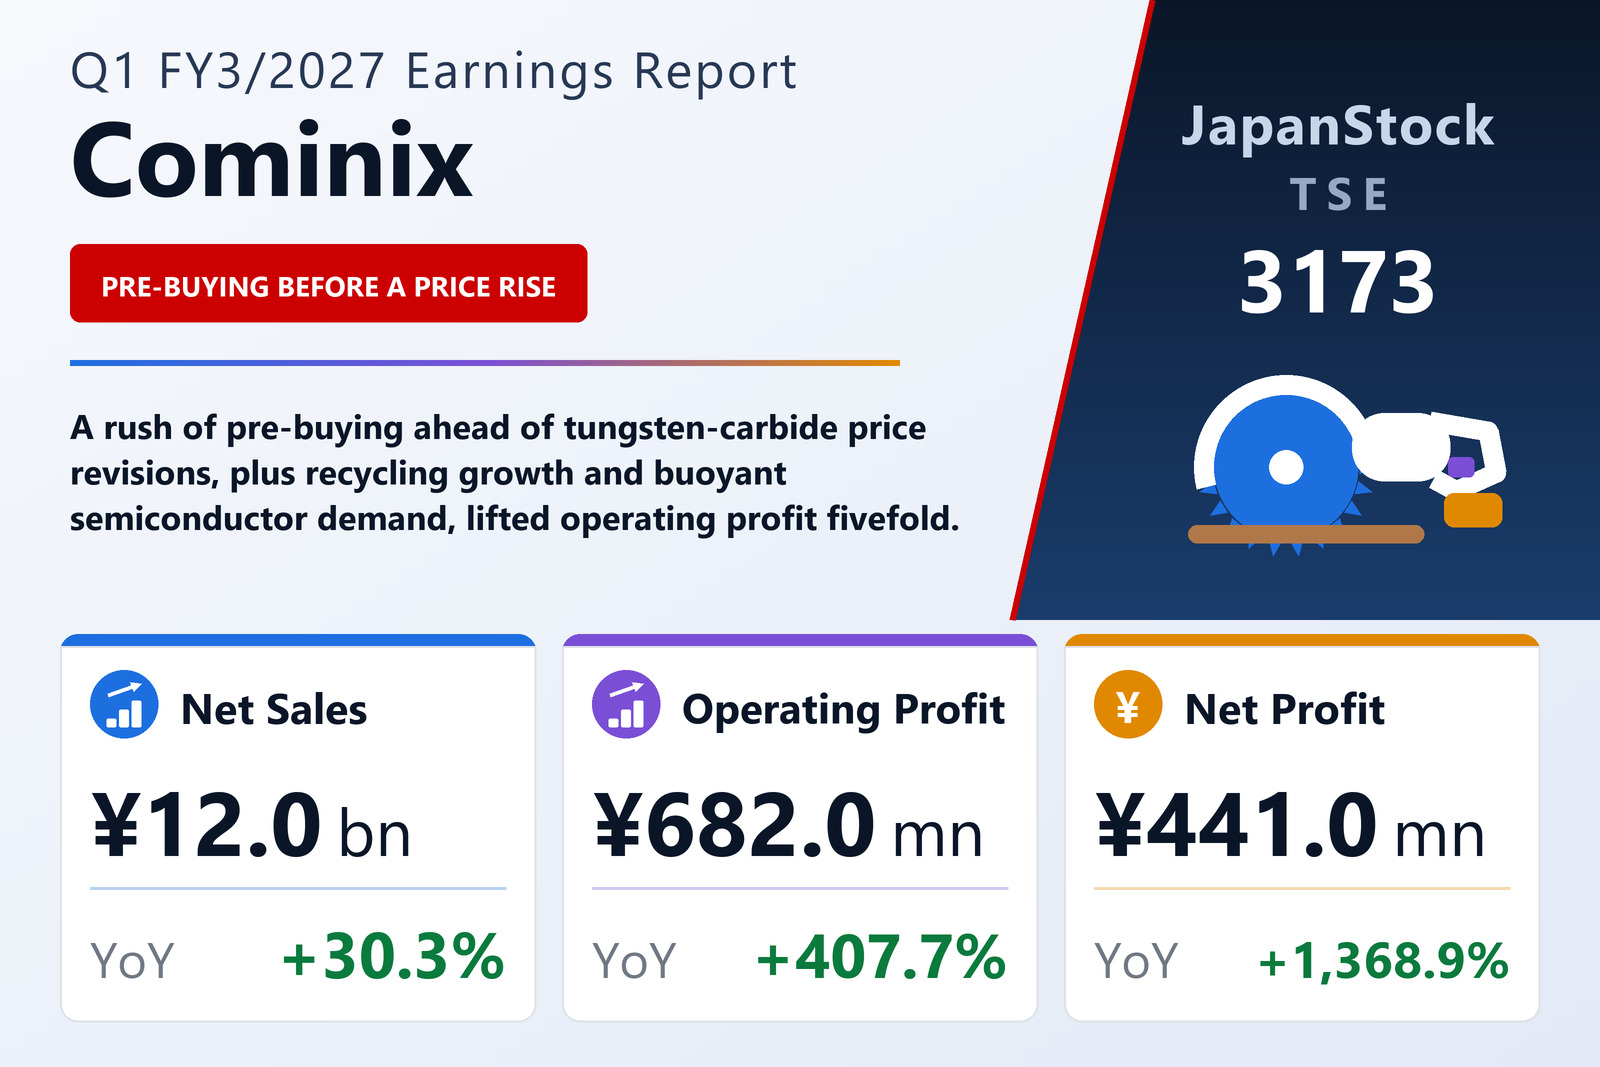
Cominix Co., Ltd. (TSE: 3173) reported consolidated first-quarter results for the year to March 2027 under Japanese GAAP on August 10. Net sales rose 30.3% to ¥12,028 million, operating profit 407.7% to ¥682 million, ordinary profit 660.5% to ¥708 million, and profit attributable to owners of the parent 1,368.9% to ¥441 million from ¥30 million a year earlier. Earnings per share were ¥64.28 against ¥4.38. The company described the quarter as delivering revenue and profit "significantly above expectations" across the group, and it was emphatic enough that management tore up guidance issued barely twelve weeks earlier.
Flat gross margin, almost no cost growth — and the profit follows
The mechanics behind the fivefold operating-profit jump are unusually simple for a trading company. Gross profit rose 29.8% to ¥2,657 million, almost exactly in line with sales, leaving the gross margin essentially unchanged at 22.1% against 22.2% a year earlier — this was a volume story, not a pricing-power story at the margin line. What changed was the cost base: selling, general and administrative expenses grew just 3.2% to ¥1,975 million. With ¥610 million of extra gross profit meeting only ¥62 million of extra overhead, virtually all of the incremental margin dropped to the operating line. Stripping out the amortisation charges arising from past acquisitions — ¥53 million of goodwill and ¥30 million of customer-related assets, unchanged year on year — adjusted operating profit reached ¥766 million against ¥218 million, a 350.3% increase. Below the operating line, a ¥15 million foreign-exchange gain (versus an ¥18 million loss a year earlier) and ¥29 million of recycling income, newly broken out as a separate line because of its growing materiality, more than offset ¥41 million of interest expense. There were no extraordinary items this year, against a ¥24 million gain on the sale of the Nagoya branch property in the prior-year quarter, so pre-tax profit still multiplied to ¥708 million from ¥117 million.
Cutting tools drive the quarter; every reported segment grows
All six reported segments posted higher sales, and five of the six posted higher profit. The core Cutting Tools business — roughly 47% of external sales — grew 41.1% to ¥5,663 million with segment profit up 1,321.1% to ¥449 million from ¥31 million. Wholesale captured the pre-buying rush ahead of major manufacturers' price revisions, while a share-expansion push at priority distributors lifted volumes; the direct-sales arm deepened its position in active end-markets such as aerospace and heavy electrical machinery and booked several large projects. Recycling-related business grew across both channels. Wear-Resistant Tools added 28.2% to ¥680 million with profit up 81.2% to ¥39 million, helped by orders in automotive-battery applications and by new lines such as collaborative robots and visual-inspection equipment aimed at customers' labour-saving needs. The Kamogawa Monozukuri Solution (KMS) unit, acquired in December 2024, lifted sales 21.7% to ¥2,847 million and profit 286.9% to ¥98 million on strong demand for electroplated tools and diamond wheels from brittle-material processing customers in semiconductor equipment, with Vietnamese and Philippine subsidiaries adding semiconductor and electronic-component orders. Optical Products rose 64.8% to ¥451 million with profit up 74.9% to ¥45 million, as machine-vision and imaging customers were won and high-margin spot sales of image-processing boards from inventory took advantage of an industry-wide device shortage. Only E-Commerce disappointed, and only mildly: sales grew 44.1% to ¥43 million but the segment stayed in the red at a ¥13 million loss, narrower than the ¥18 million a year earlier, as membership growth was offset by a payback from pre-increase stockpiling and by upfront spending on system upgrades.
Overseas sales grow, but a thin margin gets thinner
The Overseas segment is where the quarter's one clear soft spot sits. Sales rose 17.5% to ¥2,142 million — the slowest growth of any segment — while segment profit advanced just 20.9% to ¥15 million, a margin of well under 1%. North America contributed automotive capital-equipment orders and Chinese demand recovered in part, but intensifying price competition in China and the ASEAN region compressed gross margins, and local selling and administrative costs rose. Management credits the continuing weak yen, alongside the higher volumes, for keeping both sales and profit in positive territory. Currency effects show up elsewhere in the accounts too: the ¥15 million foreign-exchange gain in non-operating income, and an ¥86 million increase in the foreign-currency translation adjustment within equity. The group also established COMINIX CANADA INC. during the quarter as a consolidated sales base in Canada, extending a North American footprint that is currently the healthier half of the overseas story.
Guidance and dividend both raised on the same day
Citing the first-quarter outcome, Cominix revised the half-year and full-year forecasts it had published on May 15, 2026. For the six months to September it now expects net sales of ¥24,000 million (+27.9%), operating profit of ¥1,000 million (+251.1%), ordinary profit of ¥1,000 million (+335.6%) and net profit of ¥600 million (+830.2%), for interim EPS of ¥87.35. For the full year the targets are net sales of ¥45,000 million (+9.5%), operating profit of ¥1,600 million (+63.1%), ordinary profit of ¥1,600 million (+50.9%) and net profit of ¥1,100 million (+56.5%), giving EPS of ¥160.15. The shape of that guidance is worth noting: the first quarter alone delivered 43% of the full-year operating-profit target and 27% of the sales target, and the implied second-half sales growth is far milder than the 30% just recorded — consistent with management treating the pre-buying rush ahead of price revisions as a pull-forward rather than a new run rate. Alongside the revision the company announced an increased dividend. For FY3/2027 it now plans ¥25.00 at the interim and ¥25.00 at the year-end, for ¥50.00 annually, against ¥15.00 / ¥20.00 and ¥35.00 in FY3/2026 — a 42.9% increase that still represents a payout ratio of only about 31% of forecast EPS. The quarter marks the third year of a medium-term plan running to March 2029 under the banner of transformation into a "highly specialised trading company contributing to genuine productivity improvement," built on a shift toward higher-value-added business, faster global expansion and strategic M&A.
Balance sheet: borrowings fund a heavier working-capital load
Total assets rose ¥2,223 million to ¥27,765 million from the March 2026 year-end. Current assets grew ¥1,973 million to ¥21,661 million, driven not by cash — which slipped slightly to ¥5,630 million — but by trade receivables (+¥213 million), electronically recorded receivables (+¥219 million), inventories (+¥290 million) and, most strikingly, a ¥1,301 million increase in advance payments booked within other current assets, a signature of buying ahead of announced supplier price increases. Non-current assets added ¥249 million to ¥6,104 million as investment securities rose ¥397 million against a ¥112 million fall in deferred tax assets. The funding came largely from the bank: short-term borrowings rose ¥1,380 million, pushing current liabilities up ¥1,752 million to ¥13,298 million, while non-current liabilities fell ¥184 million to ¥5,163 million as long-term debt was repaid by ¥197 million. Net assets improved ¥655 million to ¥9,303 million — retained earnings up ¥304 million (¥441 million of quarterly profit less ¥137 million of dividends), securities valuation gains up ¥258 million and translation adjustments up ¥86 million — but because assets grew faster, the equity ratio eased to 33.4% from 33.8%. Shareholders' equity stood at ¥9,271 million. No consolidated cash-flow statement is prepared for the first quarter, so cash generation cannot be assessed directly; depreciation was ¥50 million against ¥49 million a year earlier. As a subsequent event, the board resolved on July 17, 2026 that consolidated subsidiary Kamogawa Co., Ltd. would acquire 1,000 of its own shares for a total of ¥1,018,000 through an off-market negotiated transaction — an administratively small step rather than a financially material one.
| Metric | Q1 FY3/2027 | Q1 FY3/2026 | YoY |
|---|---|---|---|
| Net sales (¥ million) | 12,028 | 9,232 | +30.3% |
| Gross profit (¥ million) | 2,657 | 2,047 | +29.8% |
| SG&A expenses (¥ million) | 1,975 | 1,913 | +3.2% |
| Operating profit (¥ million) | 682 | 134 | +407.7% |
| Adjusted operating profit (¥ million) | 766 | 218 | +350.3% |
| Ordinary profit (¥ million) | 708 | 93 | +660.5% |
| Profit attrib. to owners (¥ million) | 441 | 30 | +1,368.9% |
| Comprehensive income (¥ million) | 795 | −128 | To profit |
| EPS (¥) | 64.28 | 4.38 | +1,367.6% |
| Segment sales: Cutting Tools (¥ million) | 5,663 | 4,014 | +41.1% |
| Segment sales: KMS (¥ million) | 2,847 | 2,339 | +21.7% |
| Segment sales: Overseas (¥ million) | 2,142 | 1,823 | +17.5% |
| Segment sales: Wear-Resistant Tools (¥ million) | 680 | 530 | +28.2% |
| Segment sales: Optical Products (¥ million) | 451 | 273 | +64.8% |
| Segment sales: E-Commerce (¥ million) | 43 | 30 | +44.1% |
| Segment profit: Cutting Tools (¥ million) | 449 | 31 | +1,321.1% |
| Segment profit: KMS (¥ million) | 98 | 25 | +286.9% |
| Segment profit: Optical Products (¥ million) | 45 | 26 | +74.9% |
| Segment profit: Wear-Resistant Tools (¥ million) | 39 | 21 | +81.2% |
| Segment profit: Overseas (¥ million) | 15 | 12 | +20.9% |
| Segment profit: E-Commerce (¥ million) | −13 | −18 | Loss narrowed |
| Total assets (¥ million, vs Mar 31, 2026) | 27,765 | 25,542 | +8.7% |
| Net assets (¥ million, vs Mar 31, 2026) | 9,303 | 8,647 | +7.6% |
| Equity ratio (%) | 33.4 | 33.8 | −0.4 pt |
| FY3/2027 forecast: net sales (¥ million) | 45,000 | — | +9.5% |
| FY3/2027 forecast: operating profit (¥ million) | 1,600 | — | +63.1% |
| FY3/2027 forecast: net profit (¥ million) | 1,100 | — | +56.5% |
| Annual dividend (¥) | 50.00 | 35.00 | +42.9% |
JapanStockPulse provides informational content only and does not constitute investment advice. Figures are taken from the company's published earnings short report and may be subject to subsequent revision.