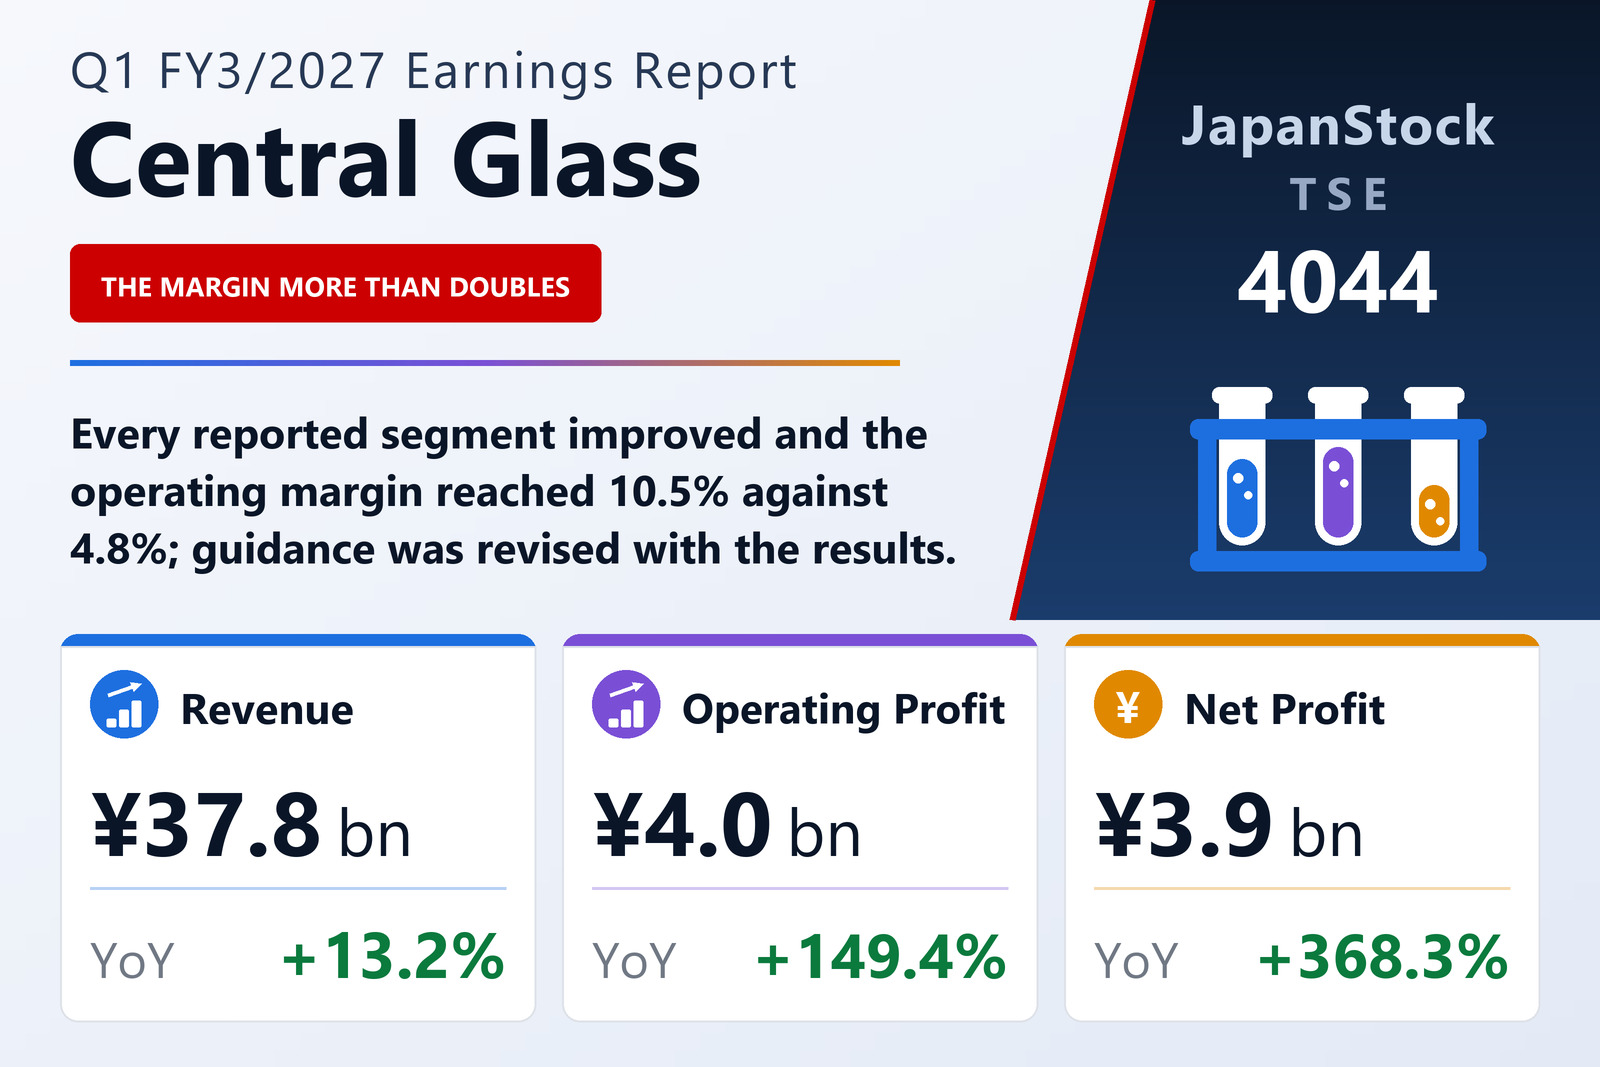
A margin that more than doubled
Central Glass Co., Ltd. (TSE: 4044) published consolidated results for the three months to June 30, 2026 on August 10, 2026 under Japanese GAAP. Net sales rose 13.2% to ¥37,763 million, operating profit 149.4% to ¥3,958 million — an increase of ¥2,371 million — ordinary profit 173.7% to ¥4,875 million and net profit 368.3% to ¥3,906 million, for earnings per share of ¥157.56 against ¥33.65. Comprehensive income was ¥6,664 million against ¥541 million, a rise the company declines to express as a percentage because it exceeds 1,000%.
The company's own summary is short: active selling lifted revenue, and efficiency and rationalisation measures across the business lifted profit. The result in the numbers is an operating margin of 10.5% against 4.8% — a business earning more than twice as much on each yen of sales as a year ago.
Every segment improved, and the smallest one improved most
Electronic Materials grew revenue 23.5% to ¥7,494 million and more than doubled its profit, up 110.8% to ¥2,134 million. Three things drove it: a weaker yen raising selling prices, price corrections on some specialty gases where raw-material costs had risen, and the clearing of a temporary shipment shortfall in resist materials that had hit the prior year.
Energy Materials grew revenue fastest of all — up 81.5% to ¥3,881 million on the scaling-up of mass production for a large domestic project — and narrowed its loss to ¥832 million from ¥1,073 million, an improvement of ¥241 million despite raw-material costs that have been rising since the second half of last year. It remains the group's one loss-making segment.
Life & Healthcare grew revenue 4.7% to ¥10,055 million and profit 74.0% to ¥1,657 million on higher revenue plus fixed-cost reductions. Within it, medical chemicals fell 21.7% to ¥2,468 million because a UK consolidated subsidiary's shares were transferred, while materials chemicals rose 22.7% to ¥5,462 million and fertiliser 6.5% to ¥2,124 million on higher unit prices. Glass, the largest segment by revenue, grew 5.1% to ¥15,031 million and profit 47.7% to ¥931 million: architectural glass ¥5,647 million (+3.5%) on price corrections despite a weak non-residential market, automotive glass ¥7,090 million (+5.5%), and glass fibre ¥2,292 million (+8.2%) on more short-fibre product for automotive use. The four named segments do not sum to the group figure; the balance sits in operations outside them.
Guidance revised — and still below last year at the ordinary line
Total assets rose 2.0% from the March year-end to ¥201,798 million: cash up ¥3,206 million and investment securities up ¥3,033 million on higher share prices, against ¥1,281 million less in receivables and ¥1,117 million less in property, plant and equipment. Liabilities fell ¥323 million to ¥69,289 million as interest-bearing debt was repaid. Net assets rose ¥4,296 million to ¥132,509 million — net profit of ¥3,906 million and a ¥2,043 million rise in valuation differences against ¥2,146 million of dividends — taking the equity ratio to 63.3% from 62.5%.
Guidance was revised with these results. For the first half the company expects net sales of ¥79,000 million (+18.9%), operating profit of ¥6,200 million (+147.8%), ordinary profit of ¥6,300 million (+84.6%) and net profit of ¥4,200 million (+96.6%), for earnings per share of ¥169.40. For the full year it expects net sales of ¥167,500 million (+15.9%) and operating profit of ¥11,000 million (+9.7%), but ordinary profit of ¥11,300 million (−8.0%) and net profit of ¥8,000 million (−4.3%), for earnings per share of ¥322.67. Read that shape carefully: the quarter has already earned 36.0% of the full-year operating-profit target and 48.8% of the net-profit target, and the two lower lines are guided below last year even though the operating line is guided above it. The annual dividend is held at ¥170.00, split ¥85.00 interim and ¥85.00 final.
| Metric | Q1 FY3/2027 | Q1 FY3/2026 | Change |
|---|---|---|---|
| Net sales (¥ million) | 37,763 | 33,368 | +13.2% |
| Operating profit (¥ million) | 3,958 | 1,586 | +149.4% |
| Operating margin | 10.5% | 4.8% | +5.7 pt |
| Ordinary profit (¥ million) | 4,875 | 1,781 | +173.7% |
| Net profit (¥ million) | 3,906 | 834 | +368.3% |
| EPS (¥) | 157.56 | 33.65 | +368.2% |
| Electronic Materials — revenue (¥ million) | 7,494 | 6,068 | +23.5% |
| Electronic Materials — segment profit (¥ million) | 2,134 | 1,012 | +110.8% |
| Energy Materials — revenue (¥ million) | 3,881 | 2,138 | +81.5% |
| Energy Materials — segment profit (¥ million) | −832 | −1,073 | loss narrowed |
| Life & Healthcare — revenue (¥ million) | 10,055 | 9,601 | +4.7% |
| Life & Healthcare — segment profit (¥ million) | 1,657 | 952 | +74.0% |
| Glass — revenue (¥ million) | 15,031 | 14,299 | +5.1% |
| Glass — segment profit (¥ million) | 931 | 630 | +47.7% |
| Total assets (¥ million) | 201,798 | 197,825 | +2.0% |
| Net assets (¥ million) | 132,509 | 128,212 | +3.4% |
| Equity ratio | 63.3% | 62.5% | +0.8 pt |
| FY3/2027 guidance — revenue (¥ million) | 167,500 | — | +15.9% |
| FY3/2027 guidance — operating profit (¥ million) | 11,000 | — | +9.7% |
| FY3/2027 guidance — ordinary profit (¥ million) | 11,300 | — | −8.0% |
| FY3/2027 guidance — net profit (¥ million) | 8,000 | — | −4.3% |
| FY3/2027 guidance — EPS (¥) | 322.67 | — | n.m. |
| Annual dividend per share (¥) | 170.00 | 170.00 | unchanged |
JapanStockPulse provides informational content only and does not constitute investment advice. Figures are taken from the company's published earnings short report and may be subject to subsequent revision.