Growth that came from the wrong reason
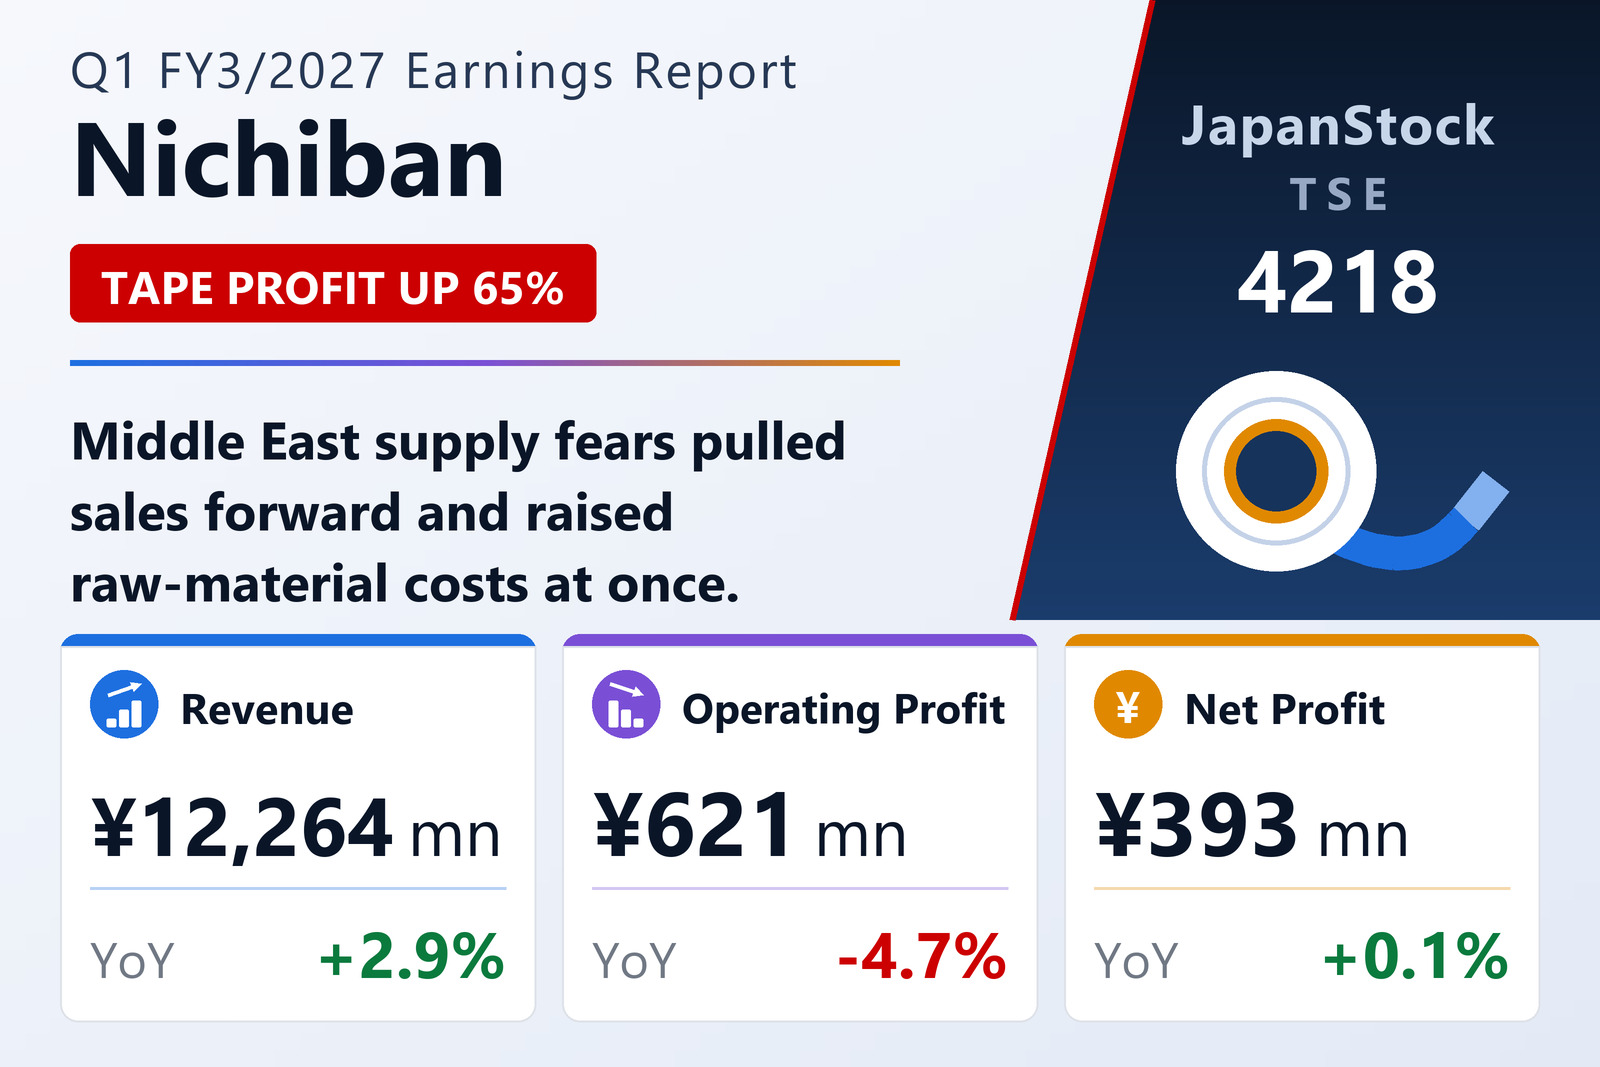
Nichiban Co., Ltd. (TSE: 4218) published consolidated results for the three months to June 30, 2026 on August 10, 2026 under Japanese GAAP. Net sales rose 2.9% to ¥12,264 million, operating profit fell 4.7% to ¥621 million, ordinary profit fell 1.2% to ¥668 million and net profit rose 0.1% to ¥393 million, for earnings per share of ¥19.49 against ¥19.31.
The company is explicit about where the revenue came from: rush demand triggered by supply anxiety over the deteriorating situation in the Middle East. The same cause worked against the profit line, raising raw-material prices, and the medical business added promotional spending on top. The operating margin narrowed to 5.1% from 5.5%.
The two segments diverged sharply. Medical sales rose 1.4% to ¥6,006 million but segment profit fell 9.9% to ¥1,402 million after television advertising and other promotion behind the Care-Leaves adhesive-plaster and Roihi pain-relief lines. Tape sales rose 4.3% to ¥6,257 million and segment profit 64.9% to ¥411 million, helped by price revisions on Cellotape and Tabanera tape. Unallocated corporate costs of ¥1,192 million (against ¥1,154 million) sit between the segment total of ¥1,814 million and the reported ¥621 million.
Field by field
Inside Medical, the healthcare field rose 5.9% to ¥3,700 million as advertising lifted Care-Leaves and the Roihi Tsubo-Ko Cool patch, and its e-commerce field rose 9.7% to ¥309 million. Against that, the medical-materials field fell 9.7% to ¥1,270 million: Surgifit surgical-wound dressings gained adoption at national university and acute-care hospitals, but the Atofine scar-care tape lost hospital-shop sales to online channels and the group had ended a contract-manufacturing arrangement with one customer in the prior year. The medical global field slipped 1.8% to ¥726 million, partly because a typhoon delayed a Korean shipment.
Inside Tape, the industrial field rose 9.2% to ¥3,606 million on price revisions to Tabanera tape and Cellotape plus a model change on a major domestic vehicle that created new demand for vinyl masking tape. Stationery rose 3.4% to ¥1,072 million and e-commerce 7.3% to ¥1,093 million, but the tape global field fell 24.3% to ¥485 million as raw-material shortages forced production adjustments on Panfix cellulose tape.
Balance sheet and a back-loaded full-year target
Total assets fell 2.7% from the March year-end to ¥65,486 million, with accounts receivable down ¥1,154 million as prior-year collections completed and new receivables were suppressed by shipment adjustments. Liabilities fell ¥1,443 million to ¥21,538 million: current borrowings due within a year fell ¥2,000 million while long-term borrowings rose ¥1,000 million on refinancing. The equity ratio improved to 67.1% from 65.9%.
Guidance is unchanged and demands a great deal of the rest of the year. For the first half the company expects net sales of ¥25,500 million (+5.6%), operating profit of ¥1,200 million (+17.0%) and net profit of ¥500 million (−23.8%). For the full year it expects net sales of ¥52,000 million (+3.0%), operating profit of ¥3,600 million (+58.5%), ordinary profit of ¥3,700 million (+51.5%) and net profit of ¥2,300 million (+39.2%), for earnings per share of ¥113.06. The quarter delivered just 17.3% of the full-year operating-profit target on 23.6% of the sales target, so the remaining nine months carry almost all of the promised improvement. The annual dividend is held at ¥40.00, paid entirely at year-end.
| Metric | Q1 FY3/2027 | Q1 FY3/2026 | Change |
|---|---|---|---|
| Net sales (¥ million) | 12,264 | 11,923 | +2.9% |
| Operating profit (¥ million) | 621 | 651 | −4.7% |
| Operating margin | 5.1% | 5.5% | −0.4 pt |
| Ordinary profit (¥ million) | 668 | 676 | −1.2% |
| Net profit (¥ million) | 393 | 393 | +0.1% |
| EPS (¥) | 19.49 | 19.31 | +0.9% |
| Medical — revenue (¥ million) | 6,006 | 5,923 | +1.4% |
| Medical — segment profit (¥ million) | 1,402 | 1,556 | −9.9% |
| Tape — revenue (¥ million) | 6,257 | 5,999 | +4.3% |
| Tape — segment profit (¥ million) | 411 | 249 | +64.9% |
| Total assets (¥ million) | 65,486 | 67,307 | −2.7% |
| Net assets (¥ million) | 43,948 | 44,325 | −0.9% |
| Equity ratio | 67.1% | 65.9% | +1.2 pt |
| FY3/2027 guidance — revenue (¥ million) | 52,000 | — | +3.0% |
| FY3/2027 guidance — operating profit (¥ million) | 3,600 | — | +58.5% |
| FY3/2027 guidance — ordinary profit (¥ million) | 3,700 | — | +51.5% |
| FY3/2027 guidance — net profit (¥ million) | 2,300 | — | +39.2% |
| FY3/2027 guidance — EPS (¥) | 113.06 | — | n.m. |
| Annual dividend per share (¥) | 40.00 | 40.00 | unchanged |
JapanStockPulse provides informational content only and does not constitute investment advice. Figures are taken from the company's published earnings short report and may be subject to subsequent revision.