The small segment carried the quarter
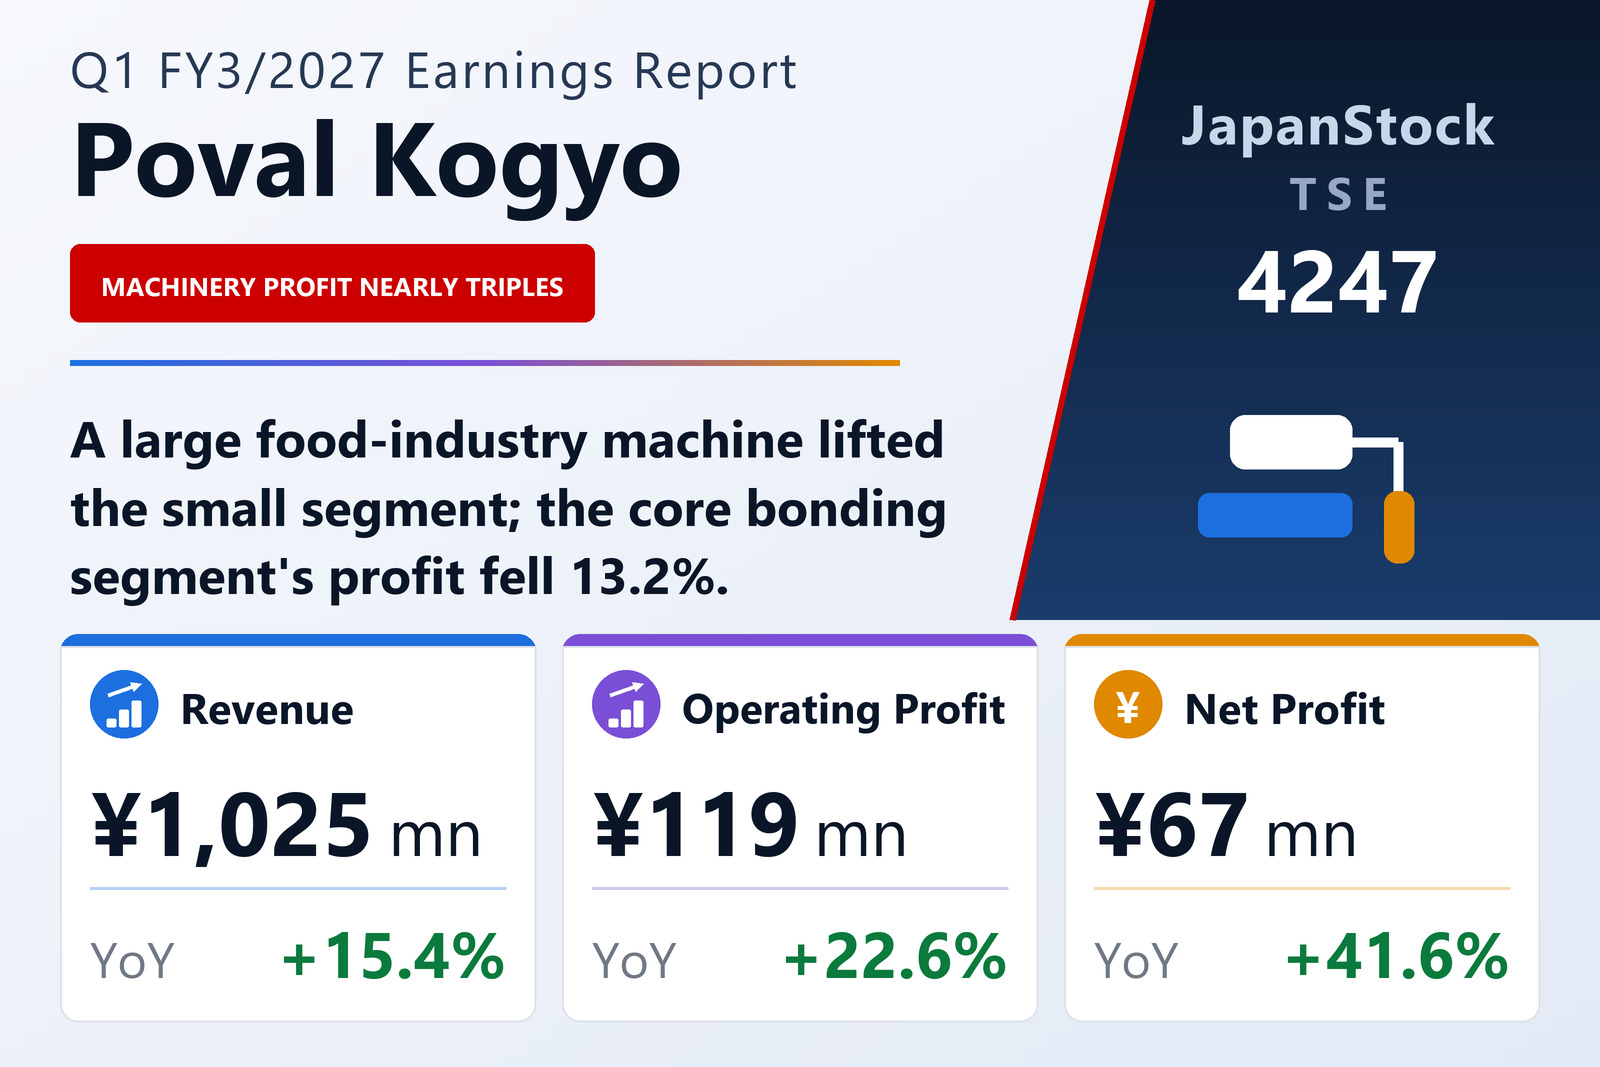
Poval Kogyo Co., Ltd. (TSE: 4247) published consolidated results for the three months to June 30, 2026 on August 10, 2026 under Japanese GAAP. Net sales rose 15.4% to ¥1,025 million, operating profit 22.6% to ¥119 million, ordinary profit 21.3% to ¥131 million and net profit 41.6% to ¥67 million, for earnings per share of ¥25.65 against ¥18.11.
The two segments moved in opposite directions on profit. Bonding & Resin Processing, which is 80.7% of sales, grew revenue 11.2% to ¥827 million but its segment profit fell 13.2% to ¥84 million. Special Design Machinery grew revenue 36.6% to ¥198 million and its segment profit 172.2% to ¥43 million — an increase of ¥27.6 million against the core segment's ¥12.7 million decline. Unallocated corporate costs also shrank, to ¥7.8 million from ¥15.0 million, which is the rest of the bridge to the reported operating profit.
Within bonding, belt products held steady on orders from the automotive and steel industries, and polishing materials sold into the display industry performed strongly. Within machinery, mechanical seals were firm and a large machine for the food industry was recognised in the period — a lumpy item that helps explain both the revenue jump and the near-tripling of segment profit, and one that should not be assumed to repeat every quarter.
What the company says it is working on
The company describes four workstreams for the period: deepening relationships with existing customers, expanding sales channels for next-generation semiconductor polishing pads, improving material yield, and improving production processes to reduce cost. That is a cost-and-mix agenda rather than a capacity one, and it is consistent with a margin that rose to 11.7% from 11.0%.
One comparison point is worth flagging. The prior-year quarter carried ¥31.7 million of extraordinary income — a ¥2.5 million asset-sale gain and a ¥29.2 million gain on liquidating an affiliate — with none this year, and it also carried an unusually heavy tax charge at 65.0% of pre-tax profit against 48.2% this time. Those two effects largely cancel in the comparison, but the 41.6% net-profit growth is not a clean read-through from the 22.6% operating gain.
A balance sheet that scarcely moved, and guidance calling for a weaker year
Total assets fell ¥5 million to ¥7,271 million, liabilities fell ¥17 million to ¥1,215 million and net assets rose ¥12 million to ¥6,055 million. The equity ratio is 83.1% against 82.8% — among the least leveraged balance sheets on the exchange — and net assets per share edged up to ¥2,292.55 from ¥2,288.07. Comprehensive income doubled to ¥69 million from ¥33 million.
Guidance published on May 14, 2026 is unchanged and looks for a weaker year than the quarter suggests. For the first half the company expects net sales of ¥1,918 million (+4.1%), operating profit of ¥192 million (−21.1%), ordinary profit of ¥201 million (−20.1%) and net profit of ¥147 million (−5.5%). For the full year it expects net sales of ¥3,800 million (+5.4%), operating profit of ¥393 million (−6.6%), ordinary profit of ¥410 million (−14.4%) and net profit of ¥308 million (−17.3%), for earnings per share of ¥116.94. The quarter already delivered 30.3% of the full-year operating-profit target on 27.0% of the sales target. The annual dividend rises to ¥42.00 from ¥41.00, split ¥21.00 interim and ¥21.00 final.
| Metric | Q1 FY3/2027 | Q1 FY3/2026 | Change |
|---|---|---|---|
| Net sales (¥ million) | 1,025 | 888 | +15.4% |
| Operating profit (¥ million) | 119 | 97 | +22.6% |
| Operating margin | 11.7% | 11.0% | +0.7 pt |
| Ordinary profit (¥ million) | 131 | 108 | +21.3% |
| Net profit (¥ million) | 67 | 47 | +41.6% |
| EPS (¥) | 25.65 | 18.11 | +41.6% |
| Bonding & Resin Processing — revenue (¥ million) | 827 | 743 | +11.2% |
| Bonding & Resin Processing — segment profit (¥ million) | 84 | 96 | −13.2% |
| Special Design Machinery — revenue (¥ million) | 198 | 145 | +36.6% |
| Special Design Machinery — segment profit (¥ million) | 43 | 16 | +172.2% |
| Total assets (¥ million) | 7,271 | 7,277 | −0.1% |
| Net assets (¥ million) | 6,055 | 6,043 | +0.2% |
| Equity ratio | 83.1% | 82.8% | +0.3 pt |
| FY3/2027 guidance — revenue (¥ million) | 3,800 | — | +5.4% |
| FY3/2027 guidance — operating profit (¥ million) | 393 | — | −6.6% |
| FY3/2027 guidance — ordinary profit (¥ million) | 410 | — | −14.4% |
| FY3/2027 guidance — net profit (¥ million) | 308 | — | −17.3% |
| FY3/2027 guidance — EPS (¥) | 116.94 | — | n.m. |
| Annual dividend per share (¥) | 42.00 | 41.00 | +2.4% |
JapanStockPulse provides informational content only and does not constitute investment advice. Figures are taken from the company's published earnings short report and may be subject to subsequent revision.