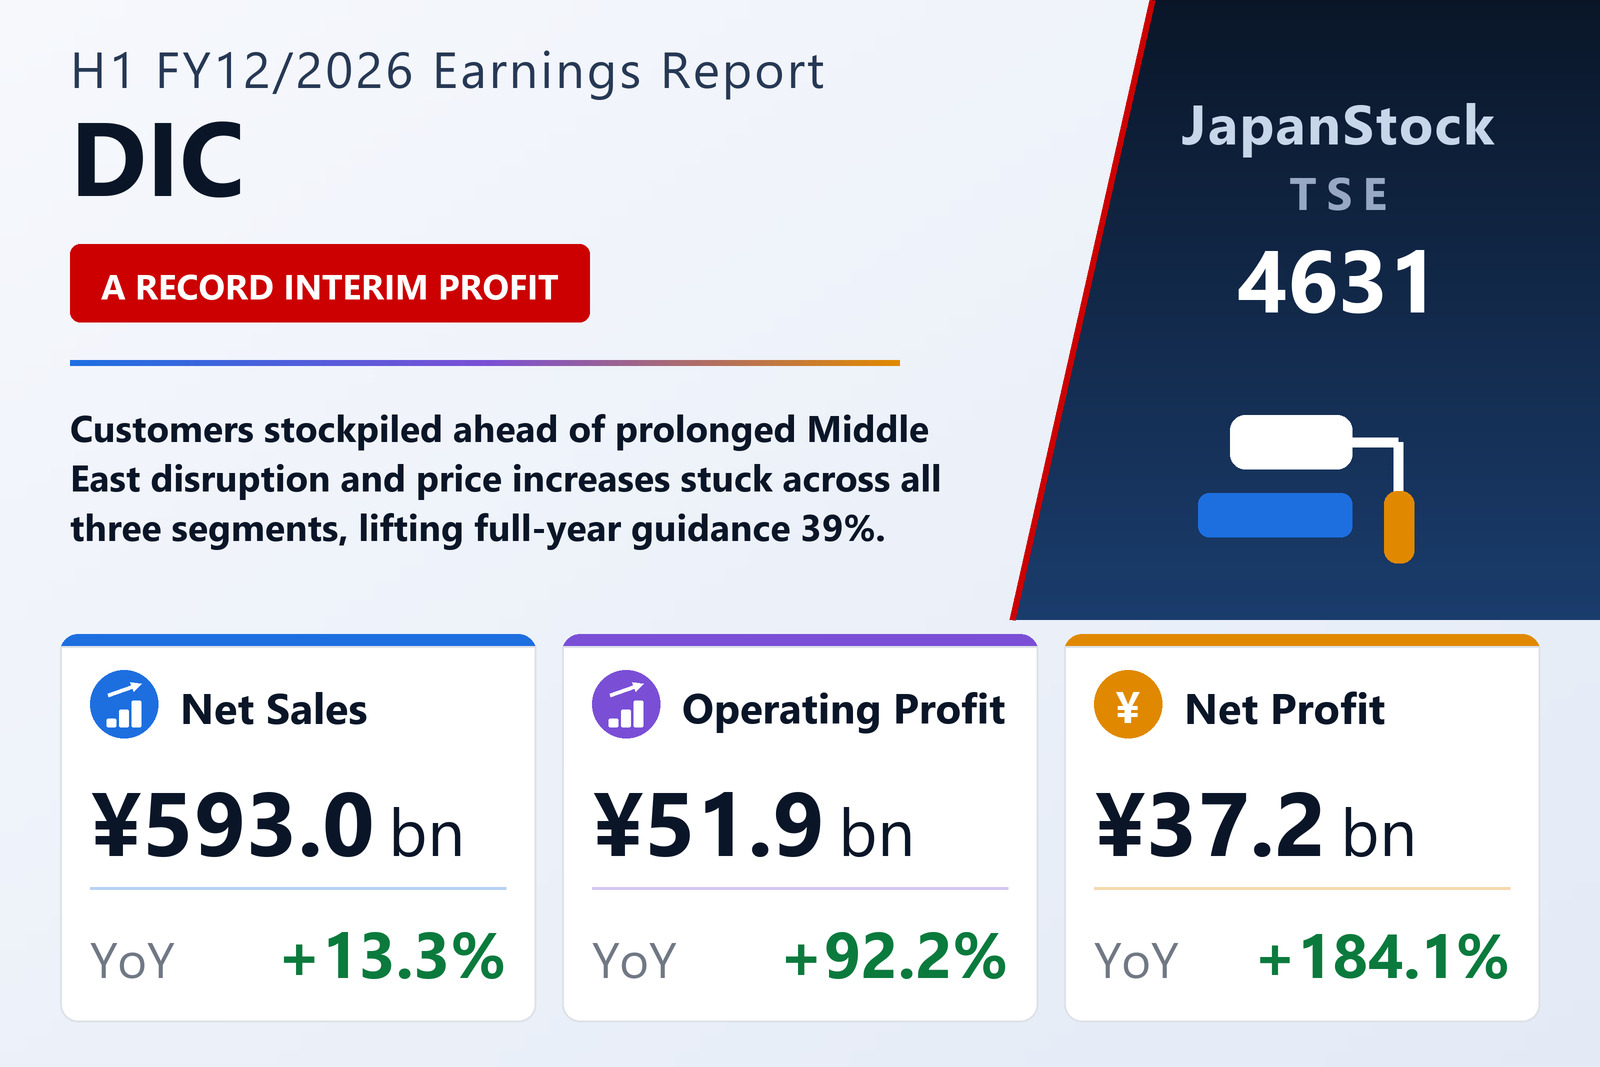
DIC Corporation (TSE: 4631) reported consolidated results for the first half of the year to December 2026 under Japanese GAAP on August 10. This is an interim (six-month) result covering January 1 to June 30, 2026 — DIC runs a December fiscal year-end, so the figures below are half-year cumulative numbers, not a first quarter and not a March-year outcome. Net sales rose 13.3% to ¥592,983 million, operating profit jumped 92.2% to ¥51,850 million, ordinary profit surged 157.7% to ¥52,308 million and profit attributable to owners of the parent climbed 184.1% to ¥37,187 million. Earnings per share came in at ¥392.69 against ¥138.27 a year earlier. Comprehensive income swung to a positive ¥54,222 million from a negative ¥404 million, and EBITDA rose 64.8% to ¥80.9 billion. Management described the operating profit figure as a record for any interim consolidated period in the company's history.
Price pass-through and a weak yen do most of the heavy lifting
The gap between the headline growth rate and the underlying one is the first thing to understand about this result. Sales grew 13.3% in reported yen but only 5.8% on a local-currency basis; operating profit grew 92.2% reported and 79.8% in local currency. The average dollar rate moved to ¥158.32 from ¥148.58 and the euro to ¥184.54 from ¥162.72, a 6.6% and 13.4% translation tailwind respectively on a group that earns the majority of its revenue outside Japan. Underneath the currency effect, the operating story was margin repair: gross profit rose to ¥145,228 million from ¥116,798 million, lifting the gross margin to 24.5% from 22.3%, while selling, general and administrative expenses grew only 4.0% to ¥93,379 million. Escalating crude, energy and naphtha costs stemming from Middle East tensions were passed on quickly across every segment, and cost control held the expense base broadly flat in real terms. Ordinary profit outgrew operating profit by a wide margin because non-operating expenses more than halved to ¥5,430 million from ¥9,927 million, principally on a smaller foreign-exchange loss from hyperinflation accounting in emerging markets, while equity-method income of ¥3,491 million and interest income of ¥1,463 million padded the non-operating credit side.
All three segments expand, with Functional Products and Color & Display leading
Functional Products was the sharpest performer on profit, with sales up 13.0% to ¥161.6 billion and segment profit up 96.4% to ¥21.3 billion. Epoxy resins used in semiconductor package substrates and encapsulants benefited from voracious AI-chip demand — shipments of active-ester hardeners for insulating materials were particularly strong — while industrial tapes for smartphones expanded into high-end handsets despite memory-shortage worries, and PPS compounds shipped well into both mobility and housing-equipment applications. Color & Display more than doubled segment profit to ¥12.0 billion from ¥5.7 billion on an 8.6% sales gain to ¥142.5 billion, though on a local-currency basis sales were essentially flat at +0.1%. Coatings pigments sold well in Europe for architectural and industrial uses, plastics pigments grew in Europe, North America and Asia, and colour-filter pigments recovered as panel makers raised utilisation to meet flat-panel TV demand around this summer's football World Cup; cosmetics pigments fell after the company strategically discontinued some low-value lines. Packaging & Graphic, still the largest unit, grew sales 14.3% to ¥307.2 billion and segment profit 62.6% to ¥21.7 billion, with every region in profit growth. Packaging inks rose on price actions even as Japanese shipments softened on cost-of-living-driven consumption weakness; publication inks kept shrinking structurally in Japan and the Americas and Europe but gained in Asia; jet inks recovered as a temporary inventory adjustment worked through; and polystyrene for food trays rose on pricing. Note that DIC changed its segment aggregation method from this interim period under the second phase of its "DIC Vision 2030" long-term plan, which sets FY2030 ROIC targets by reporting segment — prior-year segment figures have been restated on the new basis.
A ¥5.9 billion German liability reversal, and a customer stockpile that has to unwind
Two items deserve to be stripped out before extrapolating. First, Color & Display's profit doubling was helped by a ¥5.9 billion reversal booked in the first quarter: a repair-related liability recognised in prior years at a German pigment site, on the assumption that the work was legally required, was released after a third-party body determined it was no longer necessary. That is roughly half of the segment's entire first-half profit and will not repeat. Second, and more important for the shape of the year, several product lines across packaging inks, publication inks and coating resins benefited from customers building inventory in anticipation of a prolonged Middle East situation — a pull-forward of demand that management explicitly identifies as a downside risk for the second half, alongside raw-material cost increases still working their way into the cost base. Crude and naphtha prices have calmed from their peaks and supply-chain disruption is easing, which removes the pricing tailwind as well as the volume one. The arithmetic is stark: full-year operating profit guidance of ¥78.0 billion against ¥51.85 billion already banked implies roughly ¥26.2 billion in the second half, only about half the first-half run rate.
Guidance raised across every line, dividend lifted and a buyback resolved
DIC revised upward the forecasts it published on May 15. Full-year sales guidance rose to ¥1,140.0 billion from ¥1,100.0 billion (+8.3% year on year), operating profit to ¥78.0 billion from ¥56.0 billion (+49.4%), ordinary profit to ¥73.0 billion from ¥48.0 billion (+65.0%), net profit attributable to owners to ¥48.0 billion from ¥33.0 billion (+48.4%) and EBITDA to ¥130.0 billion from ¥111.0 billion (+19.0%). Guided earnings per share is ¥507.99. The company expects every profit line below sales to set a record. Assumed rates for the year are ¥150.00 to the dollar and ¥175.00 to the euro, against actual averages of ¥150.08 and ¥169.58 in FY12/2025 — a conservative dollar assumption given the ¥158.32 average already realised in the first half. On capital returns, the interim dividend is ¥70.00 per share, up from ¥50.00, payable from September 1. The board raised the year-end forecast to ¥80.00 from ¥70.00, taking the annual total to ¥150.00; that still sits below the ¥200.00 paid for FY12/2025, which carried an unusually large ¥150.00 year-end payment. Separately, the board resolved on August 10 to acquire treasury shares, with details in a same-day disclosure; the guided EPS figure already reflects the buyback's expected effect.
Balance sheet, cash generation and the Taiyo Holdings exit
Total assets grew ¥56.6 billion to ¥1,330,726 million against the December 2025 year-end, driven by higher trade receivables (¥266,284 million from ¥231,445 million), heavier inventories and yen-translation inflation of overseas balances. Liabilities rose ¥17.7 billion to ¥800,909 million as payables climbed to ¥152,513 million, while net assets rose ¥39.0 billion to ¥529,817 million on retained earnings of ¥232,808 million and a foreign-currency translation adjustment that swelled to ¥81,809 million from ¥64,151 million. The equity ratio improved to 38.3% from 37.0%, and shareholders' equity reached ¥510,034 million. Summing the disclosed debt lines, gross interest-bearing borrowings eased slightly to roughly ¥433.8 billion from ¥440.2 billion, with the mix shifting from short-term borrowings (down to ¥95,181 million from ¥126,247 million) toward long-term debt (¥225,632 million from ¥198,909 million). Operating cash flow nearly doubled to ¥42.1 billion from ¥21.5 billion, with pre-tax profit of ¥52,093 million and depreciation of ¥27,692 million offset by a ¥18.5 billion working-capital build and ¥7.2 billion of tax payments. Investing outflows were ¥17.9 billion — ¥22.9 billion of capital expenditure against ¥5.5 billion raised from selling artworks — and financing outflows ¥27.5 billion, including ¥14.2 billion of dividends and ¥8.6 billion of loan repayments. Cash and cash equivalents ended the half at ¥68,233 million. Looking further out, the biggest structural change is the planned exit from Taiyo Holdings: on March 31 DIC signed a basic agreement with KJ005 Inc., a KKR-backed vehicle, under which DIC will not tender its 20.19% stake (22,469,200 shares) into the tender offer but will instead have Taiyo repurchase the entire holding for approximately ¥82.6 billion. DIC concluded that further synergy with Taiyo was limited given shifts in the electronics landscape and Taiyo's move into medical and pharmaceutical businesses, and wants capital concentrated on its Smart Living priority area. The tender offer is targeted to begin around early October 2026, with a share consolidation from mid-November 2026 to late January 2027, the treasury-share purchase from early February to early March 2027, and dissolution of the 2017 capital and business alliance thereafter — at which point Taiyo leaves DIC's equity-method scope.
| Metric | H1 FY12/2026 | H1 FY12/2025 | YoY |
|---|---|---|---|
| Net sales (¥ billion) | 592.98 | 523.24 | +13.3% |
| Operating profit (¥ billion) | 51.85 | 26.98 | +92.2% |
| Ordinary profit (¥ billion) | 52.31 | 20.30 | +157.7% |
| Profit attrib. to owners (¥ billion) | 37.19 | 13.09 | +184.1% |
| EPS (¥) | 392.69 | 138.27 | +184.0% |
| EBITDA (¥ billion) | 80.90 | 49.10 | +64.8% |
| Gross margin (%) | 24.5 | 22.3 | +2.2 pt |
| Segment sales: Packaging & Graphic (¥ billion) | 307.16 | 268.76 | +14.3% |
| Segment sales: Color & Display (¥ billion) | 142.55 | 131.31 | +8.6% |
| Segment sales: Functional Products (¥ billion) | 161.56 | 142.96 | +13.0% |
| Segment profit: Packaging & Graphic (¥ billion) | 21.73 | 13.37 | +62.6% |
| Segment profit: Color & Display (¥ billion) | 12.01 | 5.67 | +112.0% |
| Segment profit: Functional Products (¥ billion) | 21.35 | 10.87 | +96.4% |
| Operating cash flow (¥ billion) | 42.07 | 21.54 | +95.3% |
| Interim dividend per share (¥) | 70.00 | 50.00 | +40.0% |
| Total assets (¥ billion, vs Dec 31, 2025) | 1,330.73 | 1,274.09 | +4.4% |
| Equity ratio (%, vs Dec 31, 2025) | 38.3 | 37.0 | +1.3 pt |
| FY12/2026 operating profit guidance (¥ billion) | 78.00 | 56.00 | Raised |
JapanStockPulse provides informational content only and does not constitute investment advice. Figures are taken from the company's published earnings short report and may be subject to subsequent revision.