The two halves of the business moved in opposite directions
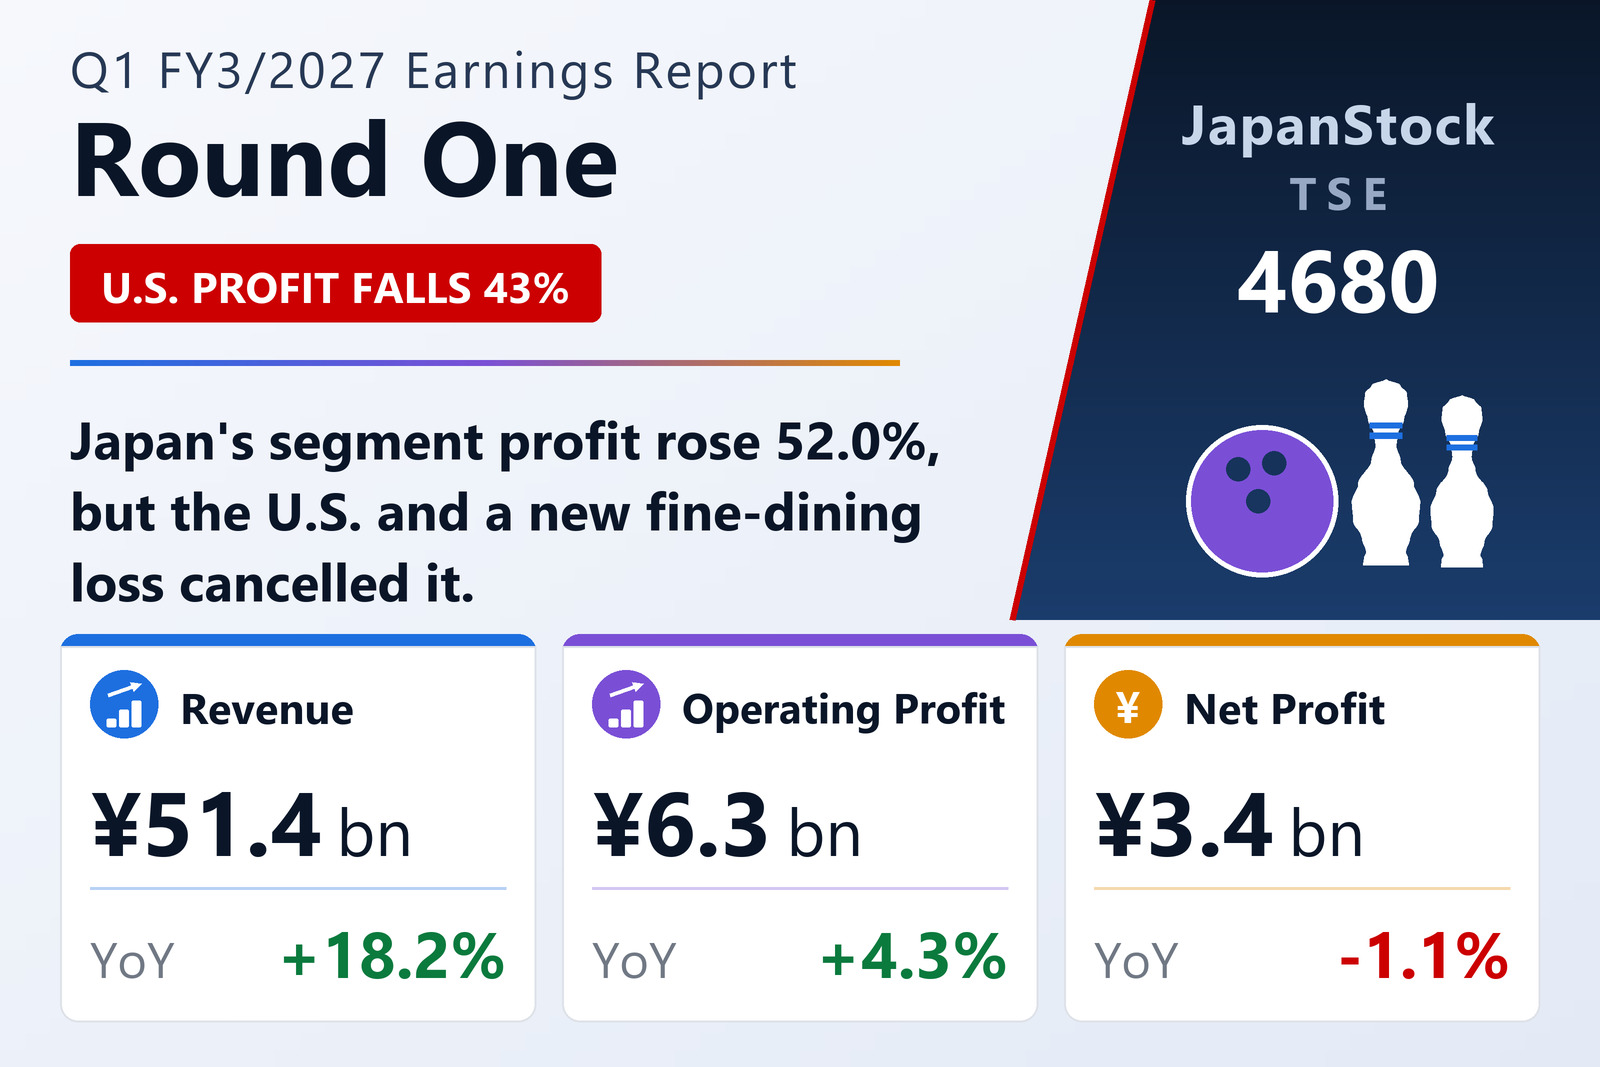
Round One Corporation (TSE: 4680) published consolidated results for the three months to June 30, 2026 on August 10, 2026 under IFRS. Revenue rose 18.2% to ¥51,377 million, operating profit 4.3% to ¥6,339 million and pre-tax profit 2.1% to ¥5,267 million, while profit attributable to owners of the parent fell 1.1% to ¥3,368 million, for earnings per share of ¥12.81 against ¥12.99.
The segment table explains the gap between the top and bottom lines. Japan grew revenue 16.9% to ¥28,549 million and segment profit 52.0% to ¥5,543 million, lifting its margin to 19.4% from 14.9%. The United States grew revenue 20.6% to ¥22,561 million but its segment profit fell 43.1% to ¥1,618 million, cutting its margin to 7.2% from 15.2%. In yen terms Japan added ¥1,897 million of segment profit and the U.S. gave back ¥1,226 million.
The newly separated Fine Dining segment — Japanese restaurants in the United States, carved out of "Other" because the business opened during the current financial year — booked no revenue and a segment loss of ¥806 million against ¥396 million a year earlier. Together the U.S. decline and the widened fine-dining loss are worth ¥1,636 million, which is why an ¥7,892 million revenue increase produced only ¥263 million of extra operating profit.
Every revenue line grew, on both sides of the Pacific
In Japan the company reports bowling revenue up 11.3%, amusement up 21.3%, karaoke up 14.8% and Spo-Cha up 13.7%. It opened one new store — Saikaya Yokosuka in Kanagawa — in May 2026 and had rolled out its Toresugi-no Island crane-game zones, stocked with food and household prizes, to 76 stores by the end of June.
In the United States bowling revenue rose 15.2%, amusement 20.7%, food and other 25.3% and Spo-Cha 7.8%. The company attributes the amusement growth to regular introduction of its own original prizes and to limited-time collaboration campaigns; it does not give a reason in this filing for the segment's sharply lower profit.
Balance sheet, seasonality and guidance
Total assets rose 5.9% from the March year-end to ¥328,319 million, with cash up ¥9,228 million and property, plant and equipment up ¥9,989 million. Liabilities rose ¥15,275 million to ¥242,528 million, of which bonds and borrowings accounted for ¥13,955 million. Equity attributable to owners rose 3.8% to ¥85,792 million but the ratio eased to 26.1% from 26.7% because assets grew faster. Finance costs rose to ¥1,438 million from ¥1,072 million, against finance income of ¥255 million.
The company notes that its indoor leisure complexes earn more in the second and fourth quarters, when long holidays fall, so quarterly results are uneven by design. On that basis the quarter delivered 19.2% of the full-year operating-profit target on 23.5% of the revenue target.
Guidance is unchanged. For the first half the company expects revenue of ¥103,730 million (+12.8%), operating profit of ¥15,010 million (+0.4%), pre-tax profit of ¥12,220 million (−8.5%) and profit of ¥7,900 million (−10.8%). For the full year it expects revenue of ¥219,090 million (+15.6%), operating profit of ¥33,050 million (+14.9%), pre-tax profit of ¥27,450 million (+8.0%) and profit of ¥18,260 million (+9.9%), for earnings per share of ¥69.46. The annual dividend is held at ¥18.00, paid ¥4.50 a quarter.
| Metric | Q1 FY3/2027 | Q1 FY3/2026 | Change |
|---|---|---|---|
| Revenue (¥ million) | 51,377 | 43,485 | +18.2% |
| Operating profit (¥ million) | 6,339 | 6,076 | +4.3% |
| Operating margin | 12.3% | 14.0% | −1.7 pt |
| EBITDA (¥ million) | 17,492 | 16,518 | +5.9% |
| Pre-tax profit (¥ million) | 5,267 | 5,157 | +2.1% |
| Net profit attrib. to owners of parent (¥ million) | 3,368 | 3,405 | −1.1% |
| EPS (¥) | 12.81 | 12.99 | −1.4% |
| Japan — revenue (¥ million) | 28,549 | 24,423 | +16.9% |
| Japan — segment profit (¥ million) | 5,543 | 3,646 | +52.0% |
| United States — revenue (¥ million) | 22,561 | 18,715 | +20.6% |
| United States — segment profit (¥ million) | 1,618 | 2,844 | −43.1% |
| Fine Dining — segment profit (¥ million) | −806 | −396 | loss widened |
| Total assets (¥ million) | 328,319 | 309,888 | +5.9% |
| Equity attrib. to owners of parent (¥ million) | 85,792 | 82,635 | +3.8% |
| Equity ratio | 26.1% | 26.7% | −0.6 pt |
| FY3/2027 guidance — revenue (¥ million) | 219,090 | — | +15.6% |
| FY3/2027 guidance — operating profit (¥ million) | 33,050 | — | +14.9% |
| FY3/2027 guidance — pre-tax profit (¥ million) | 27,450 | — | +8.0% |
| FY3/2027 guidance — net profit (¥ million) | 18,260 | — | +9.9% |
| FY3/2027 guidance — EPS (¥) | 69.46 | — | n.m. |
| Annual dividend per share (¥) | 18.00 | 18.00 | unchanged |
JapanStockPulse provides informational content only and does not constitute investment advice. Figures are taken from the company's published earnings short report and may be subject to subsequent revision.