Flat revenue, much better margins
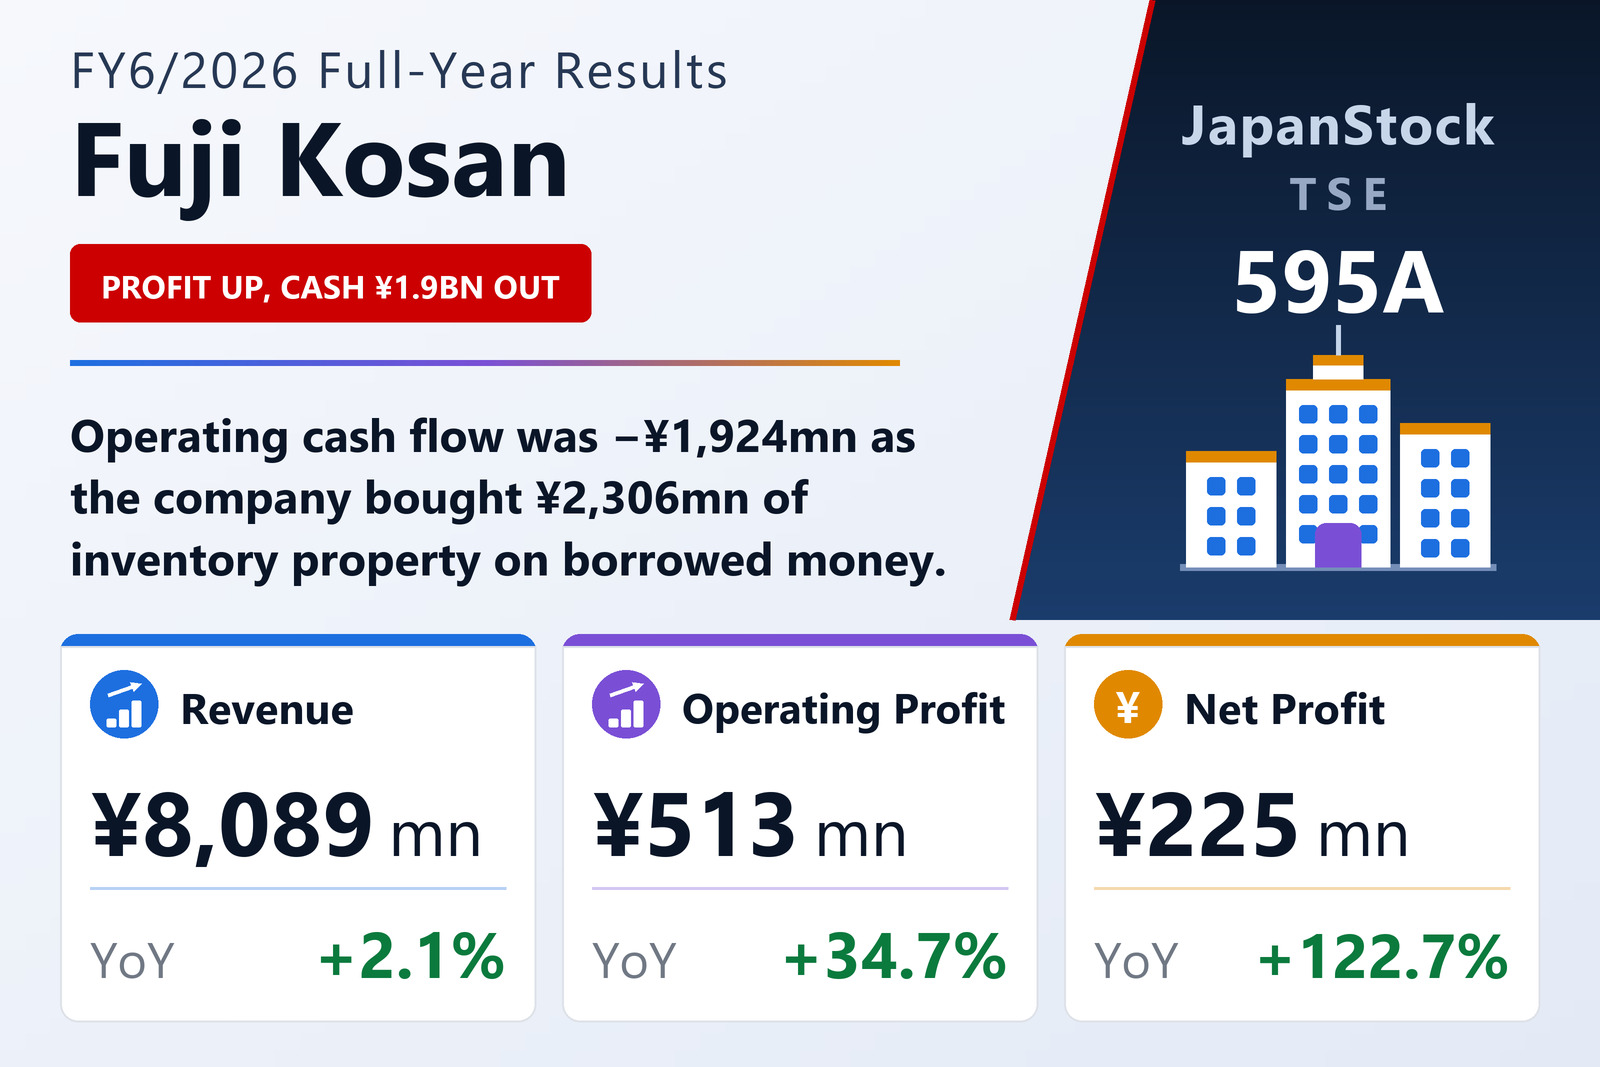
Fuji Kosan Co., Ltd. (TSE: 595A), a Nagoya-based investment-property redeveloper, published non-consolidated results for the year to June 30, 2026 on August 10, 2026 under Japanese GAAP. Net sales rose 2.1% to ¥8,089 million, operating profit 34.7% to ¥513 million, ordinary profit 48.7% to ¥329 million and net profit 122.7% to ¥225 million, for earnings per share of ¥112.75 against ¥50.62. The operating margin widened to 6.3% from 4.8% and return on equity reached 16.4% against 8.2%. The company reports a single segment: real estate, covering investment-property redevelopment, building management and property leasing.
The market it describes is two-sided. In the owner-occupier housing market, high construction costs and rising mortgage burdens kept buyers watching from the sidelines. In the investment-property market that is Fuji Kosan's main ground, higher rates have made investors markedly more selective — but demand from domestic investors seeking stable income, and from overseas investors who still find Japanese property relatively attractive, kept transactions in well-located, well-occupied assets active. The company says property sales ran ahead of plan through the year.
The profit is real; the cash went the other way
The balance sheet is where this result gets interesting. Total assets rose 35.2% to ¥8,659 million, almost entirely because inventory property rose ¥2,306 million. That purchase was funded by debt: short-term borrowings rose ¥1,651 million and long-term borrowings ¥209 million, taking total liabilities up ¥2,061 million to ¥7,188 million. Net assets rose only 15.3% to ¥1,471 million, so the equity ratio fell to 17.0% from 19.9% even in a year of record profit.
Cash flow says the same thing more bluntly. Operating cash flow was −¥1,924 million against +¥294 million a year earlier, the swing being that ¥2,306 million of inventory build. Investing cash flow was −¥320 million, mostly ¥298 million of fixed-asset purchases, and financing cash flow +¥1,981 million. Cash ended at ¥1,567 million, down ¥262 million. This is a normal shape for a property trader stocking up, but it is worth stating plainly rather than reading the profit line alone.
Guidance calls for more revenue and far less profit
Guidance for FY6/2027 is the striking part: net sales of ¥9,917 million (+22.6%) but operating profit of ¥273 million (−46.7%), ordinary profit of ¥47 million (−85.7%) and net profit of ¥30 million (−86.4%), for earnings per share of ¥15.31. The gap between the operating and ordinary lines — a 46.7% fall becoming an 85.7% fall — is the cost of the borrowing described above; ordinary profit already sits far below operating profit this year (¥329 million against ¥513 million) for the same reason.
The dividend follows the profit. Read the two years on the same basis: the company carried out a 1,000-for-1 stock split effective April 14, 2026, and the ¥15,100.00 shown for FY6/2025 is the actual pre-split amount, which the filing states explicitly. On the post-split count that is ¥15.10, so the move to ¥19.00 for FY6/2026 is a 25.8% increase — total dividends paid went from ¥30 million to ¥38 million, the same step. For FY6/2027 the forecast is ¥4.60, a 30.0% payout ratio on the much lower guided earnings.
| Metric | FY6/2026 | FY6/2025 | Change |
|---|---|---|---|
| Net sales (¥ million) | 8,089 | 7,923 | +2.1% |
| Operating profit (¥ million) | 513 | 381 | +34.7% |
| Operating margin | 6.3% | 4.8% | +1.5 pt |
| Ordinary profit (¥ million) | 329 | 221 | +48.7% |
| Net profit (¥ million) | 225 | 101 | +122.7% |
| EPS (¥) | 112.75 | 50.62 | +122.7% |
| Total assets (¥ million) | 8,659 | 6,403 | +35.2% |
| Net assets (¥ million) | 1,471 | 1,276 | +15.3% |
| Equity ratio | 17.0% | 19.9% | −2.9 pt |
| FY6/2027 guidance — revenue (¥ million) | 9,917 | — | +22.6% |
| FY6/2027 guidance — operating profit (¥ million) | 273 | — | −46.7% |
| FY6/2027 guidance — ordinary profit (¥ million) | 47 | — | −85.7% |
| FY6/2027 guidance — net profit (¥ million) | 30 | — | −86.4% |
| FY6/2027 guidance — EPS (¥) | 15.31 | — | n.m. |
| Annual dividend per share (¥) | 19.00 | 15,100.00 | n.m. |
JapanStockPulse provides informational content only and does not constitute investment advice. Figures are taken from the company's published earnings short report and may be subject to subsequent revision.