One segment supplies nearly all the revenue growth
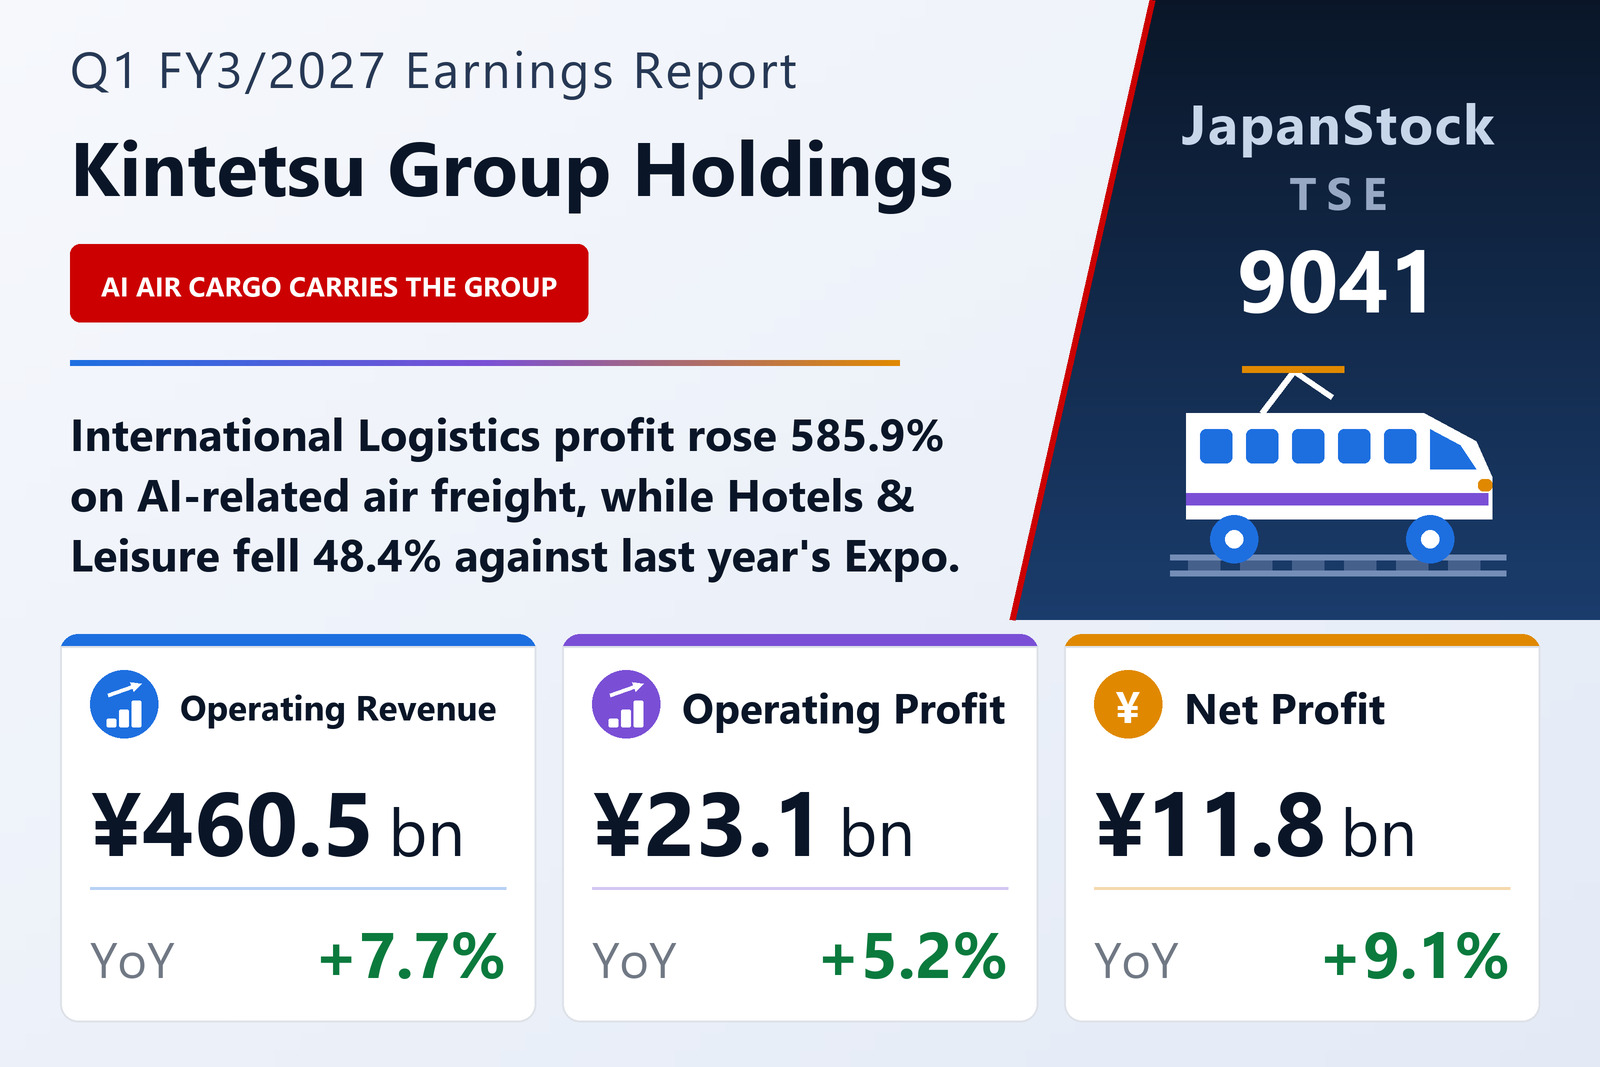
Kintetsu Group Holdings Co., Ltd. (TSE: 9041), the Osaka-based railway and diversified group, published consolidated results for the three months to June 30, 2026 on August 10, 2026 under Japanese GAAP. Operating revenue rose 7.7% to ¥460,532 million, operating profit 5.2% to ¥23,134 million, ordinary profit 1.8% to ¥21,090 million and net profit 9.1% to ¥11,758 million, for earnings per share of ¥61.84 against ¥56.67. Comprehensive income was ¥17,275 million, up 224.0%.
International Logistics is the story. Revenue rose 18.7% to ¥216,886 million — nearly half the group's total — and profit rose 585.9% to ¥4,451 million from ¥648 million. The company attributes it to air-freight volumes rising on firm movement of AI-related cargo including semiconductors, combined with the pass-through of higher selling prices at a time when freight costs stayed elevated partly because of tensions in the Middle East. That single segment supplied ¥34,244 million of the group's ¥32,836 million revenue increase.
Two segments were pulled down by the same event in reverse. The 2025 Osaka-Kansai Expo ran in the prior-year quarter, so this year faces its reaction. Hotels & Leisure revenue slipped 0.6% to ¥90,743 million but profit fell 48.4% to ¥2,282 million: travel handled fewer group and inbound tours against the Expo comparison and Middle East tensions, while the hotel business met the Expo reaction compounded by China's travel-restraint advisory. Retailing also faced the Expo comparison — revenue down 0.6% to ¥54,254 million — but profit rose 37.5% to ¥2,297 million as department stores drew customers with floor renovations and events, and duty-free sales held firm.
Rail held its revenue and lost its margin
Transportation, the group's identity, was flat on revenue at ¥57,707 million (+0.1%) but its profit fell 18.2% to ¥8,203 million. Leisure travel to the Ise-Shima area ran strongly on the railway, which offset the Expo reaction on the top line, but higher personnel costs and higher depreciation from new general rolling stock took the profit down. Real Estate did the reverse: revenue down 1.9% to ¥41,194 million as the condominium business sold fewer units, but profit up 8.4% to ¥4,912 million as newly acquired rental properties began contributing. Other grew revenue 1.4% to ¥12,851 million and profit 7.8% to ¥1,143 million.
Below the operating line the picture flattens. Ordinary profit rose only 1.8% because interest expense increased on higher rates, and net profit rose 9.1% helped by a gain on the sale of fixed assets recorded in extraordinary income.
A balance sheet where the two equity lines move apart
Total assets rose 0.5% to ¥2,607,466 million — cash down, but receivables, property held for sale and property, plant and equipment all up. Liabilities rose ¥30,401 million to ¥1,931,939 million, raised through commercial paper and long-term borrowings. The equity lines are worth separating: total net assets fell 2.4% to ¥675,527 million, yet shareholders' equity rose to ¥621,350 million from ¥611,706 million and the equity ratio improved to 23.8% from 23.6%. The difference is non-controlling interests, which fell from ¥80,258 million to ¥54,177 million.
Guidance is unchanged, and it points down from here. For the first half the company expects operating revenue of ¥887,000 million (+3.6%), operating profit of ¥35,000 million (−17.0%), ordinary profit of ¥35,000 million (−12.0%) and net profit of ¥20,000 million (−15.7%), for earnings per share of ¥105.18. For the full year it expects operating revenue of ¥1,840,000 million (+5.1%), operating profit of ¥90,000 million (+0.6%), ordinary profit of ¥82,000 million (−3.0%) and net profit of ¥47,000 million (−12.6%), for earnings per share of ¥247.18. A quarter that grew net profit 9.1% therefore sits inside a year guided to shrink it 12.6%. The annual dividend is guided up to ¥70.00 from ¥60.00, split ¥35.00 interim and ¥35.00 final.
| Metric | Q1 FY3/2027 | Q1 FY3/2026 | Change |
|---|---|---|---|
| Operating revenue (¥ million) | 460,532 | 427,696 | +7.7% |
| Operating profit (¥ million) | 23,134 | 21,992 | +5.2% |
| Operating margin | 5.0% | 5.1% | −0.1 pt |
| Ordinary profit (¥ million) | 21,090 | 20,725 | +1.8% |
| Net profit (¥ million) | 11,758 | 10,776 | +9.1% |
| EPS (¥) | 61.84 | 56.67 | +9.1% |
| Transportation — revenue (¥ million) | 57,707 | 57,638 | +0.1% |
| Transportation — segment profit (¥ million) | 8,203 | 10,031 | −18.2% |
| Real Estate — revenue (¥ million) | 41,194 | 41,999 | −1.9% |
| Real Estate — segment profit (¥ million) | 4,912 | 4,530 | +8.4% |
| International Logistics — revenue (¥ million) | 216,886 | 182,642 | +18.7% |
| International Logistics — segment profit (¥ million) | 4,451 | 648 | +585.9% |
| Retailing — revenue (¥ million) | 54,254 | 54,569 | −0.6% |
| Retailing — segment profit (¥ million) | 2,297 | 1,670 | +37.5% |
| Hotels & Leisure — revenue (¥ million) | 90,743 | 91,320 | −0.6% |
| Hotels & Leisure — segment profit (¥ million) | 2,282 | 4,420 | −48.4% |
| Other — revenue (¥ million) | 12,851 | 12,678 | +1.4% |
| Other — segment profit (¥ million) | 1,143 | 1,060 | +7.8% |
| Total assets (¥ million) | 2,607,466 | 2,593,502 | +0.5% |
| Net assets (¥ million) | 675,527 | 691,964 | −2.4% |
| Equity ratio | 23.8% | 23.6% | +0.2 pt |
| FY3/2027 guidance — operating revenue (¥ million) | 1,840,000 | — | +5.1% |
| FY3/2027 guidance — operating profit (¥ million) | 90,000 | — | +0.6% |
| FY3/2027 guidance — ordinary profit (¥ million) | 82,000 | — | −3.0% |
| FY3/2027 guidance — net profit (¥ million) | 47,000 | — | −12.6% |
| FY3/2027 guidance — EPS (¥) | 247.18 | — | n.m. |
| Annual dividend per share (¥) | 70.00 | 60.00 | +16.7% |
JapanStockPulse provides informational content only and does not constitute investment advice. Figures are taken from the company's published earnings short report and may be subject to subsequent revision.