One segment supplied the entire increase
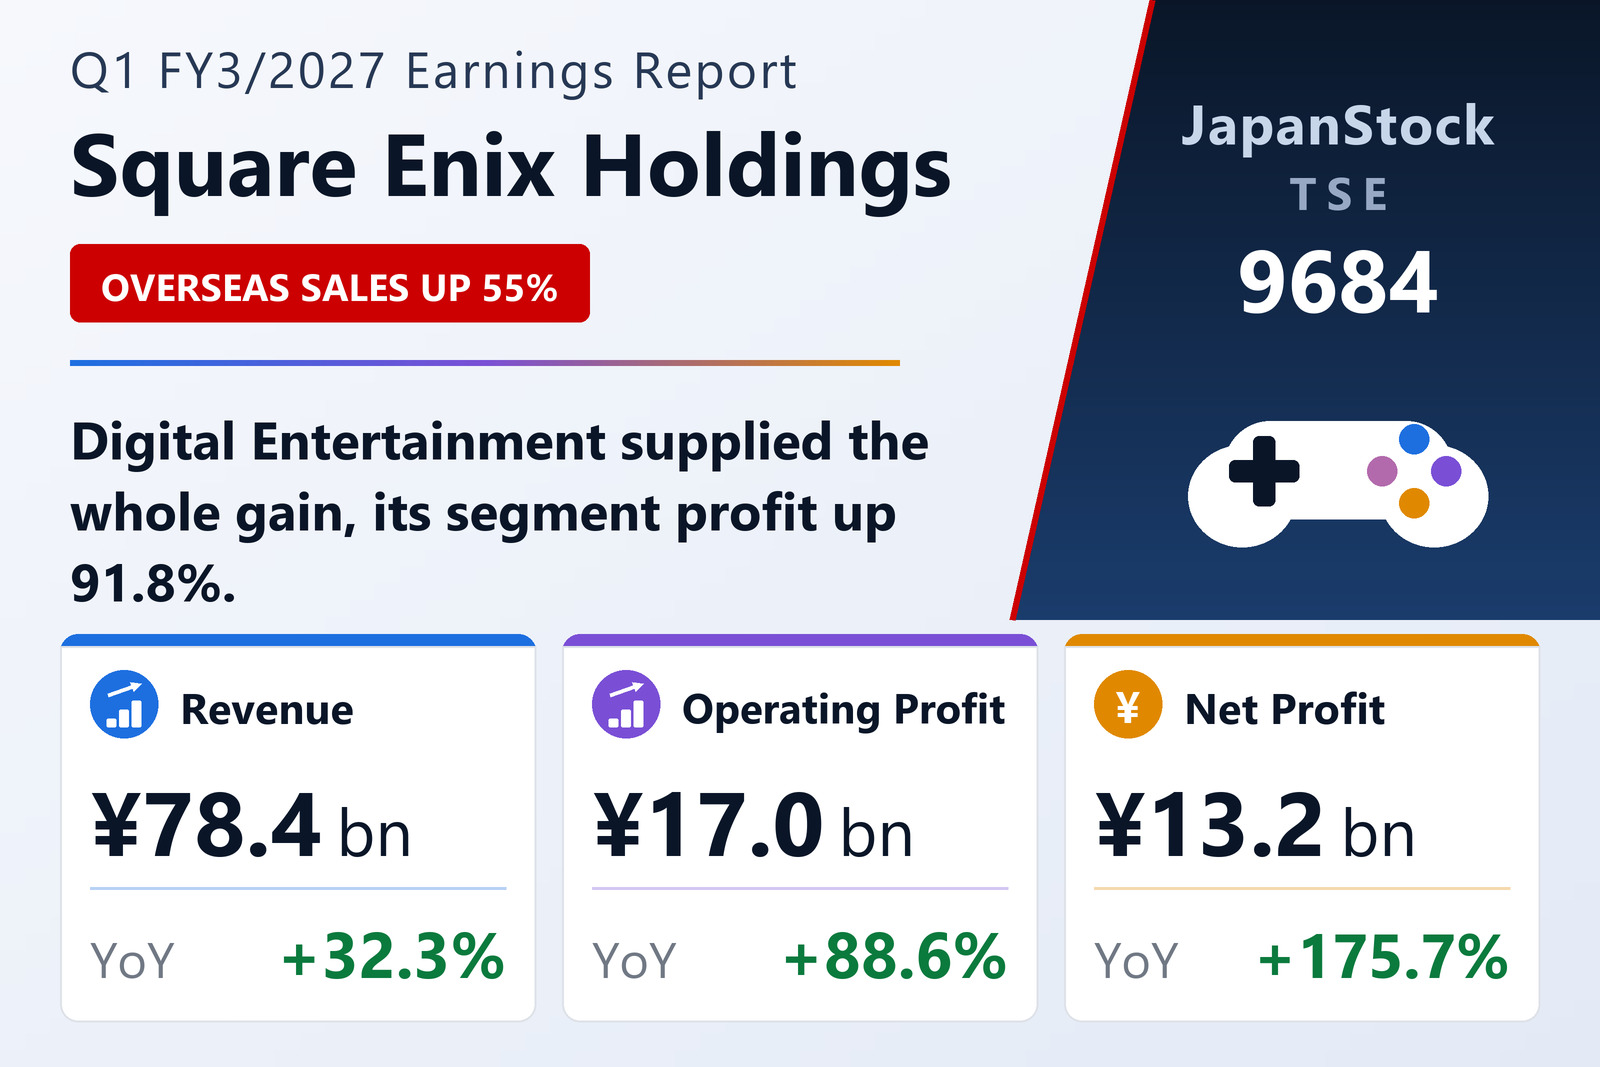
Square Enix Holdings Co., Ltd. (TSE: 9684) published consolidated results for the three months to June 30, 2026 on August 10, 2026 under Japanese GAAP. Net sales rose 32.3% to ¥78,423 million, operating profit 88.6% to ¥17,008 million, ordinary profit 172.4% to ¥18,766 million and net profit 175.7% to ¥13,244 million, for earnings per share of ¥36.73 against ¥13.33.
Digital Entertainment did essentially all the work. Its sales rose 51.8% to ¥49,960 million and its segment profit 91.8% to ¥15,583 million — a ¥7,457 million increase against a group operating-profit increase of ¥7,990 million. The other three segments together added ¥864 million, and unallocated corporate costs grew ¥332 million to ¥4,557 million.
Within that segment the company names three sources: HD console and PC titles, where Final Fantasy VII Rebirth on Nintendo Switch 2, Xbox Series X|S and Windows and The Adventures of Elliot: The Millennium Tales held up alongside stronger catalogue sales; the smart-device and browser business, where Dissidia Duellum Final Fantasy and Dragon Quest Smash Grow contributed; and the MMO business, where Final Fantasy XIV activity improved after an expansion announcement but profit rose only slightly because costs for a launch scheduled for early 2027 were booked ahead.
The overseas half is what changed
The revenue split makes the shift plain. Overseas sales rose 54.6% to ¥27,171 million while domestic sales rose 22.9% to ¥51,252 million, so the overseas share moved to 34.6% from 29.6%. Digital Entertainment alone took ¥23,547 million overseas against ¥14,235 million a year earlier.
Amusement sales rose 3.8% to ¥17,088 million on higher same-arcade sales and prize sales, with segment profit up 7.8% to ¥1,913 million. Publication rose 11.0% to ¥7,261 million on comic volume sales, and Rights & Properties 22.3% to ¥4,611 million on new character merchandise from major IP; their segment profits rose 17.7% and 28.7%.
Below the operating line, and what guidance implies
Ordinary profit grew far faster than operating profit for a reason that will not repeat automatically. Non-operating expenses fell to ¥23 million from ¥2,484 million: the prior year carried a ¥2,147 million foreign-exchange loss, while this quarter booked a ¥766 million exchange gain. Interest income also rose to ¥706 million from ¥318 million. Together those items are worth roughly ¥3.3 billion of the ¥11,877 million ordinary-profit increase.
The balance sheet stayed heavy with cash. Total assets fell 1.7% from the March year-end to ¥430,751 million as cash and deposits dropped ¥16,362 million, while receivables rose ¥5,330 million and content production accounts ¥4,110 million. Net assets rose 1.6% to ¥354,714 million and the equity ratio improved to 82.2% from 79.6%.
Full-year FY3/2027 guidance is unchanged at net sales of ¥298,000 million (+0.1%), operating profit of ¥49,000 million (−10.5%), ordinary profit of ¥49,000 million (−24.0%) and net profit of ¥31,000 million (+4.7%), for earnings per share of ¥85.99. The quarter therefore delivered 34.7% of the full-year operating-profit target on 26.3% of the sales target — and the guidance still calls for the operating line to fall for the year, which means the company expects the remaining nine months to be materially weaker than the one just reported. No first-half guidance is published. The annual dividend is held at ¥43.00 on a post-split basis, with an ¥18.00 interim; per-share figures reflect the three-for-one stock split of October 1, 2025.
| Metric | Q1 FY3/2027 | Q1 FY3/2026 | Change |
|---|---|---|---|
| Net sales (¥ million) | 78,423 | 59,275 | +32.3% |
| Gross profit (¥ million) | 44,156 | 33,451 | +32.0% |
| Operating profit (¥ million) | 17,008 | 9,018 | +88.6% |
| Operating margin | 21.7% | 15.2% | +6.5 pt |
| Ordinary profit (¥ million) | 18,766 | 6,889 | +172.4% |
| Net profit (¥ million) | 13,244 | 4,804 | +175.7% |
| EPS (¥) | 36.73 | 13.33 | +175.5% |
| Digital Entertainment — revenue (¥ million) | 49,960 | 32,918 | +51.8% |
| Digital Entertainment — segment profit (¥ million) | 15,583 | 8,126 | +91.8% |
| Amusement — revenue (¥ million) | 17,088 | 16,461 | +3.8% |
| Amusement — segment profit (¥ million) | 1,913 | 1,775 | +7.8% |
| Publication — revenue (¥ million) | 7,261 | 6,544 | +11.0% |
| Publication — segment profit (¥ million) | 2,509 | 2,131 | +17.7% |
| Rights & Properties — revenue (¥ million) | 4,611 | 3,771 | +22.3% |
| Rights & Properties — segment profit (¥ million) | 1,559 | 1,211 | +28.7% |
| Total assets (¥ million) | 430,751 | 438,018 | −1.7% |
| Net assets (¥ million) | 354,714 | 349,224 | +1.6% |
| Equity ratio | 82.2% | 79.6% | +2.6 pt |
| FY3/2027 guidance — revenue (¥ million) | 298,000 | — | +0.1% |
| FY3/2027 guidance — operating profit (¥ million) | 49,000 | — | −10.5% |
| FY3/2027 guidance — ordinary profit (¥ million) | 49,000 | — | −24.0% |
| FY3/2027 guidance — net profit (¥ million) | 31,000 | — | +4.7% |
| FY3/2027 guidance — EPS (¥) | 85.99 | — | n.m. |
| Annual dividend per share (¥) | 43.00 | 43.00 | unchanged |
JapanStockPulse provides informational content only and does not constitute investment advice. Figures are taken from the company's published earnings short report and may be subject to subsequent revision.