Revenue up half again, operating profit up two-thirds
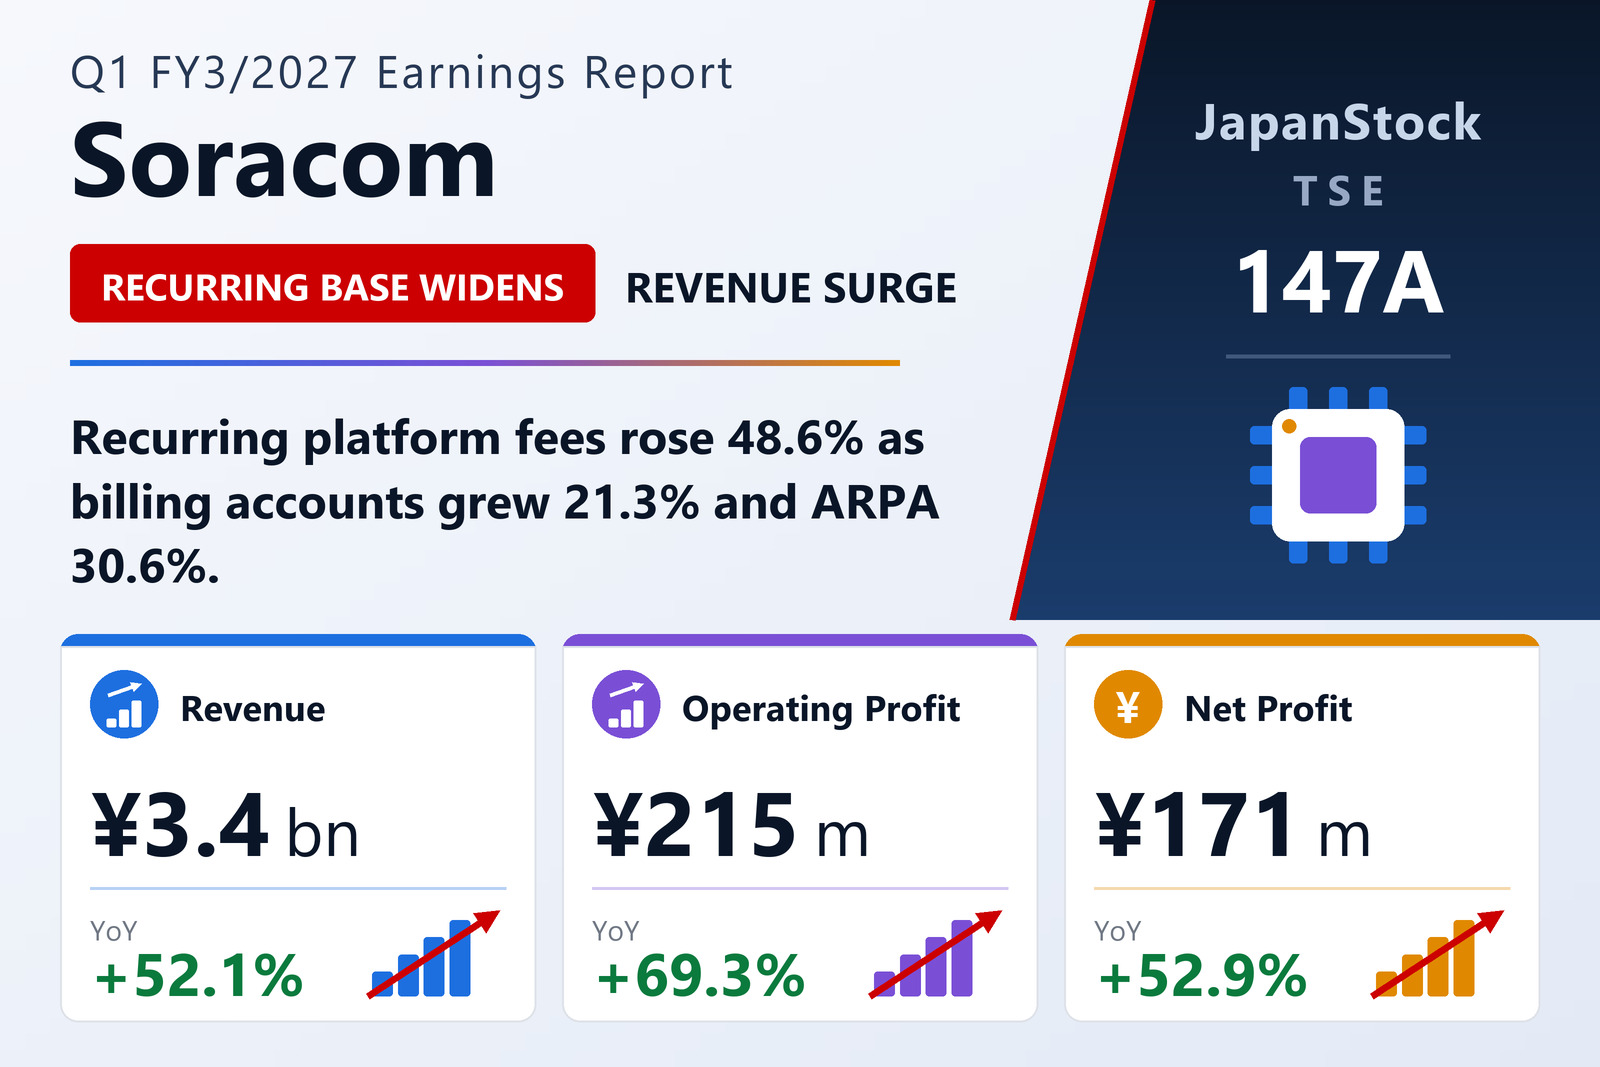
Soracom, Inc. (TSE: 147A) reported consolidated results for the first quarter of the year to March 2027 — April 1 to June 30, 2026 — under Japanese GAAP. Revenue rose 52.1% to ¥3,384 million, operating profit 69.3% to ¥215 million, ordinary profit 69.5% to ¥202 million, and profit attributable to owners of the parent 52.9% to ¥171 million. Basic earnings per share came to ¥3.77 against ¥2.49 a year earlier, with diluted EPS of ¥3.66 versus ¥2.42. Comprehensive income nearly tripled, up 194.2% to ¥128 million. The AI/IoT connectivity platform operator, led by President and Chief Executive Officer Ken Tamagawa and majority-owned by KDDI, disclosed the figures on August 12, 2026; as is standard for a Japanese first quarter, the statements were not subjected to an audit-firm review.
The company reports a single segment — the AI/IoT platform business — so there is no divisional split to read. Two lines below operating profit are worth noting. Non-operating expenses of ¥13.2 million, against just ¥0.25 million of non-operating income, pulled ordinary profit slightly below the operating line; they consisted of ¥3.3 million of interest paid, a ¥7.7 million foreign-exchange loss and ¥2.2 million of share issuance costs. And profit attributable to owners of the parent, at ¥171.9 million, exceeded total quarterly net profit of ¥145.4 million, because non-controlling interests absorbed a loss of ¥26.6 million — more than double the ¥12.1 million they absorbed a year earlier.
Profit attributable to owners grew more slowly than operating profit for a simple reason: tax. Total income tax expense rose to ¥57.5 million from ¥19.2 million, lifting the effective rate on pre-tax profit to roughly 28.3% from 16.1%. On an operating basis the improvement was far larger than the bottom line suggests.
The recurring line: more accounts, and more from each
Recurring revenue — the platform usage fees Soracom treats as its core metric — reached ¥2,742.0 million, up 48.6%, and accounted for 81.0% of total revenue. Both of its components moved at once: the number of billing accounts, defined as accounts that generated recurring revenue within a given month, rose 21.3% to 10,600, while average revenue per account (ARPA) climbed 30.6% to ¥1,044 thousand. A platform adding a fifth again as many paying accounts while each of them spends nearly a third more is expanding on both axes rather than trading one for the other.
Two forces sit behind that. Misora Connect Co., Ltd., consolidated as a subsidiary from August of the previous fiscal year's second quarter, contributed revenue that was absent from the year-earlier base. Separately, recurring revenue grew steadily in the United States and Europe, and the overseas revenue ratio held at a high 45.7% — for a Japanese TSE Growth listing, an unusually international revenue base. Management frames the demand backdrop as generative AI needing physical-world data, which in turn needs IoT connectivity, and positions the platform as the layer that safely connects real-world data to AI.
The remainder of the top line is what the company calls incremental revenue — product sales plus other income. That line reached ¥642.7 million, up 69.1%, on solid device sales in Japan. It grew faster than the recurring line, but it is also the lower-margin half of the business, and that shows up immediately in the gross margin.
A thinner gross margin, a fatter operating one
Cost of sales rose to ¥1,795 million from ¥1,002 million, leaving gross profit of ¥1,589 million, up 29.9%. Because cost of sales grew faster than revenue, the gross margin narrowed sharply to 47.0% from 55.0% — the arithmetic consequence of hardware carrying a heavier weight in the mix. Selling, general and administrative expenses came to ¥1,373.7 million, up 25.3%, reflecting a full quarter of Misora Connect's cost base and deliberately heavier advertising and promotional activity.
The operating leverage is in the ratio, not the absolute figure. SG&A fell to 40.6% of revenue from 49.3%, and that nine-point improvement more than offset the eight-point erosion in gross margin. The operating margin therefore widened to 6.4% from 5.7% even as each yen of revenue carried more cost of goods.
EBITDA — which Soracom defines as operating profit plus depreciation, goodwill amortisation and share-based compensation — rose 81.5% to ¥316 million, faster than operating profit itself, because the non-cash charges added between the two lines more than doubled. Depreciation was ¥71.7 million against ¥35.0 million, and goodwill amortisation ¥24.0 million against ¥1.8 million, a thirteenfold increase that traces directly to the subsidiary acquisition.
A cash-heavy ¥15.3 billion balance sheet
Total assets stood at ¥15,280 million at June 30, 2026, down ¥219.9 million from ¥15,499 million at the end of March. Current assets fell ¥241.9 million to ¥12,558 million: accounts receivable and contract assets dropped ¥303.3 million to ¥2,009 million as the company collected on a large device delivery, while other current assets rose ¥91.0 million on prepaid cloud-server and marketing costs. Cash and deposits were essentially flat at ¥9,255 million, which alone is more than 60% of the balance sheet. Non-current assets edged up ¥24.0 million to ¥2,714 million, as platform-development software gained ¥14.6 million and software in progress ¥53.3 million against ¥24.0 million of goodwill amortised away.
Liabilities fell ¥429.7 million to ¥3,322 million. Current liabilities were down ¥363.1 million, driven by a ¥96.9 million reduction in accounts payable on device procurement and a ¥152.7 million fall in income taxes payable; non-current liabilities eased ¥66.6 million to ¥472.8 million, mainly ¥62.5 million of long-term borrowing repaid. Net assets rose ¥209.8 million to ¥11,957 million, built from the ¥171.9 million of quarterly profit plus ¥38.3 million added to each of stated capital and capital surplus through warrant exercises, and ¥4.4 million of subscription rights arising from employee share-based compensation. The equity ratio strengthened to 73.7% from 71.1%, on shareholders' equity of ¥11,258 million. No quarterly cash-flow statement was prepared.
Guidance untouched, and still no dividend
Soracom left its full-year forecast for FY3/2027 exactly where it was, saying results are tracking broadly in line with the original plan. The guidance calls for revenue of ¥15,124 million, up 21.7%, recurring revenue of ¥11,421 million, up 22.8%, EBITDA of ¥1,650 million, up 34.3%, operating profit of ¥1,122 million, up 28.8%, ordinary profit of ¥1,073 million, up 25.1%, and profit attributable to owners of ¥706 million, up 11.8%, for EPS of ¥15.49. Against those targets the first quarter delivered 22.4% of guided revenue, 24.0% of guided recurring revenue and 24.4% of guided net profit, but only 19.2% of guided operating profit and EBITDA — a profile that leaves the profit ramp weighted toward the rest of the year.
There is no dividend. The company paid ¥0.00 for FY3/2026 and forecasts ¥0.00 again for FY3/2027, unchanged from its previous announcement. Shares issued rose to 45,740,509 at June 30 from 45,579,505 at March 31 on warrant exercises, with 30 treasury shares and a weighted average of 45,669,708 shares for the quarter against 45,205,483 a year earlier. There was no change in the scope of consolidation, no change in accounting policies or estimates, and no going-concern note.
| Metric | Q1 FY3/2027 | Q1 FY3/2026 | YoY |
|---|---|---|---|
| Revenue (¥ million) | 3,384 | 2,225 | +52.1% |
| Recurring revenue (¥ million) | 2,742 | 1,845 | +48.6% |
| Incremental revenue (¥ million) | 642.7 | — | +69.1% |
| EBITDA (¥ million) | 316 | 174 | +81.5% |
| Operating profit (¥ million) | 215 | 127 | +69.3% |
| Ordinary profit (¥ million) | 202 | 119 | +69.5% |
| Net profit attrib. to owners (¥ million) | 171 | 112 | +52.9% |
| Basic EPS (¥) | 3.77 | 2.49 | +51.4% |
| Diluted EPS (¥) | 3.66 | 2.42 | +51.2% |
| Comprehensive income (¥ million) | 128 | 43 | +194.2% |
| Gross margin | 47.0% | 55.0% | −8.0 pt |
| Operating margin | 6.4% | 5.7% | +0.7 pt |
| Billing accounts (period-end) | 10,600 | — | +21.3% |
| ARPA (¥ thousand) | 1,044 | — | +30.6% |
| Overseas revenue ratio | 45.7% | — | — |
| Total assets (¥ million; vs Mar 31, 2026) | 15,280 | 15,499 | −1.4% |
| Net assets (¥ million; vs Mar 31, 2026) | 11,957 | 11,747 | +1.8% |
| Equity ratio (vs Mar 31, 2026) | 73.7% | 71.1% | +2.6 pt |
| FY3/2027 revenue guidance (¥ million) | 15,124 | — | +21.7% |
| FY3/2027 EBITDA guidance (¥ million) | 1,650 | — | +34.3% |
| FY3/2027 operating profit guidance (¥ million) | 1,122 | — | +28.8% |
| FY3/2027 net profit guidance (¥ million) | 706 | — | +11.8% |
| FY3/2027 EPS guidance (¥) | 15.49 | — | — |
| Annual dividend per share (¥; FY27 forecast vs FY26 actual) | 0.00 | 0.00 | — |
JapanStockPulse provides informational content only and does not constitute investment advice. Figures are taken from the company's published earnings short report and may be subject to subsequent revision.