The operating business grew; the comparison did not
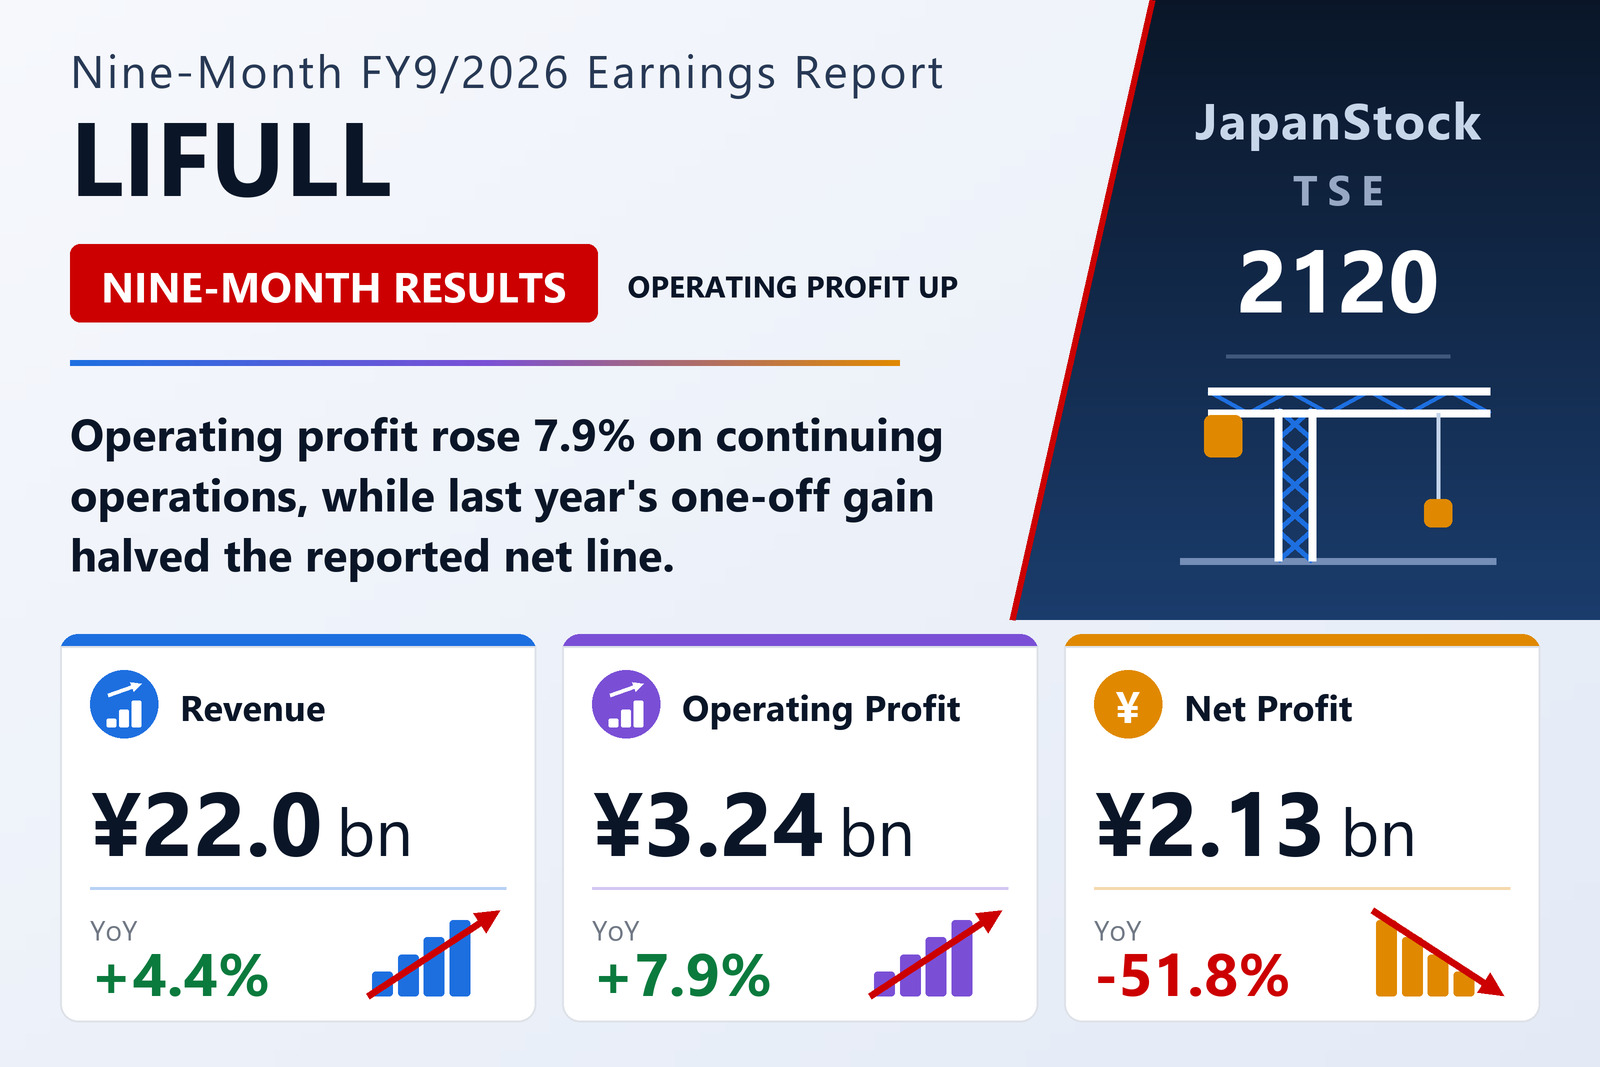
LIFULL Co., Ltd. (TSE: 2120), operator of the LIFULL HOME'S real-estate portal, reported consolidated results for the nine months to June 30, 2026 — the first three quarters of the year ending September 2026 — under IFRS. Revenue rose 4.4% to ¥21,983 million from ¥21,059 million, operating profit climbed 7.9% to ¥3,239 million from ¥3,001 million, and profit before tax advanced 11.5% to ¥3,312 million from ¥2,971 million. The operating margin widened to 14.7% from 14.3%.
Underneath, gross profit rose 4.0% to ¥20,805 million as cost of sales grew 12.2% to ¥1,177 million, and selling, general and administrative expenses rose 4.3% to ¥17,570 million — slightly slower than revenue, which is where the margin gain came from. Below the operating line, a ¥138 million gain on the sale of an equity-method investment is why pre-tax profit grew faster than operating profit; finance costs of ¥95 million exceeded finance income of ¥43 million, and equity-method losses came to ¥13 million.
The headline net figures move the other way. Profit for the period fell 52.5% to ¥2,095 million and profit attributable to owners of the parent fell 51.8% to ¥2,126 million from ¥4,408 million, taking basic earnings per share to ¥16.59 from ¥34.42 and diluted EPS to ¥16.56.
Why the net line halved — and why it is not a deterioration
From the second quarter of the year ended September 2025, LIFULL reclassified its overseas business as a discontinued operation. Revenue, operating profit and profit before tax on the face of the income statement therefore cover continuing operations only, while the entire result of the overseas business sits on a single line beneath them. A year ago that line carried a profit of ¥2,910 million; this year it is a loss of ¥7 million.
Strip it out and the direction reverses. Profit from continuing operations rose 40.3% to ¥2,103 million from ¥1,499 million, and continuing-operations basic EPS rose 42.3% to ¥16.65 from ¥11.70. The discontinued line alone contributed ¥22.73 per share a year ago; this year it costs ¥0.06. In other words, the entire ¥2,282 million fall in attributable profit — and more — is accounted for by the absence of the overseas result.
That prior-year result was itself non-recurring. The cash-flow statement for the nine months to June 2025 reverses a ¥1,224 million gain on loss of control out of pre-tax profit: the accounting gain booked when the overseas restructuring took those units out of consolidation. The company makes the same point in its own dividend note, which records that the prior year's figures included temporary items such as that gain on loss of control, alongside a ¥1 commemorative dividend marking 30 years since founding. Neither repeats in the current year.
HOME'S carries the group, but the third quarter cooled
LIFULL reports a single reportable segment, HOME'S-related business — the LIFULL HOME'S property portal, the Kenbiya investment-property site, and associated services. Including inter-segment sales it generated ¥20,042 million of revenue over the nine months, up 4.5%, with segment profit up 5.8% to ¥3,626 million. The residual "Other" category, which covers the LIFULL Kaigo senior-care facility search site and regional revitalisation businesses, grew revenue 4.1% to ¥1,961 million but widened its segment loss to ¥409 million from ¥270 million. Combined segment profit of ¥3,217 million, plus ¥17 million of consolidation adjustments and ¥4 million of net other income, reconciles to the reported ¥3,239 million operating profit. Depreciation and amortisation rose to ¥1,036 million from ¥873 million.
The third quarter in isolation was weaker than the cumulative figures imply. For April to June 2026, revenue rose 4.6% to ¥7,082 million but operating profit fell 24.0% to ¥894 million from ¥1,176 million, as HOME'S segment profit slipped to ¥1,035 million from ¥1,252 million and the "Other" loss widened to ¥146 million from ¥84 million. Quarterly profit for the period came in at ¥570 million against ¥685 million.
A stronger balance sheet and a comprehensive-income swing
Total assets stood at ¥42,531 million at June 30, 2026, up from ¥40,915 million at September 30, 2025, while equity attributable to owners of the parent rose 7.6% to ¥27,991 million and total equity reached ¥28,319 million. The equity attributable to owners ratio strengthened to 65.8% from 63.6%. Total liabilities eased to ¥14,212 million from ¥14,691 million. Cash and cash equivalents finished at ¥10,156 million against ¥10,702 million nine months earlier, and trade and other short-term receivables fell to ¥3,919 million from ¥4,160 million.
Operating cash flow improved 9.9% to ¥3,579 million from ¥3,256 million, built on pre-tax profit of ¥3,312 million and ¥1,047 million of depreciation, with a ¥248 million receivables inflow offset by a ¥461 million reduction in payables and a ¥401 million decrease in the bonus provision; income taxes were a net ¥85 million inflow. Investing activities used ¥3,848 million, far less than the ¥10,729 million consumed a year earlier. Financing activities were a net outflow of ¥301 million, against a ¥2,547 million inflow last year, as ¥1,704 million of long-term borrowings was set against ¥1,333 million of dividends paid and ¥475 million of lease liability repayments. Net cash therefore fell ¥491 million over the nine months.
Total comprehensive income jumped 123.0% to ¥3,221 million from ¥1,444 million, but the swing is a valuation effect rather than an earnings effect: gains on equity instruments measured at fair value through other comprehensive income came to ¥1,038 million against ¥158 million, and foreign currency translation differences turned to a positive ¥87 million from a negative ¥3,124 million a year earlier — the latter another consequence of the overseas restructuring.
Guidance revised up, dividend forecast raised 55%
Alongside the results, LIFULL revised both its full-year forecast and its dividend forecast upward, publishing a separate notice on August 12, 2026. For FY9/2026 the company now guides to revenue of ¥29,300 million, up 4.2%, operating profit of ¥3,900 million, up 2.2%, and profit attributable to owners of ¥2,500 million, down 53.0%, for basic EPS of ¥19.50 — the profit decline again reflecting the prior year's one-off items rather than the underlying business. The nine months already cover 75.0% of the revenue target, 83.1% of the operating profit target and 85.0% of the net profit target.
The dividend forecast for FY9/2026 was raised to ¥10.41 per share, to be paid entirely at the year-end after an interim of ¥0.00, against ¥6.72 actually paid for FY9/2025 — an increase of 54.9%, even though the comparison year included that ¥1 commemorative payment. The company states that the year-end dividend will be calculated on the basis of a 30% payout ratio, applied to the number of shares outstanding at the period end. As of June 30, 2026 there were 134,586,032 shares issued including 6,245,452 held in treasury, with a weighted average of 128,226,880 shares over the nine months.
| Metric | 9M FY9/2026 | 9M FY9/2025 | YoY |
|---|---|---|---|
| Revenue, continuing operations (¥ million) | 21,983 | 21,059 | +4.4% |
| Gross profit (¥ million) | 20,805 | 20,010 | +4.0% |
| Operating profit (¥ million) | 3,239 | 3,001 | +7.9% |
| Operating margin | 14.7% | 14.3% | +0.5 pt |
| Profit before tax (¥ million) | 3,312 | 2,971 | +11.5% |
| Profit from continuing operations (¥ million) | 2,103 | 1,499 | +40.3% |
| Profit from discontinued operations (¥ million) | −7 | 2,910 | — |
| Profit for the period (¥ million) | 2,095 | 4,410 | −52.5% |
| Profit attrib. to owners of parent (¥ million) | 2,126 | 4,408 | −51.8% |
| Basic EPS, total (¥) | 16.59 | 34.42 | −51.8% |
| Basic EPS, continuing operations (¥) | 16.65 | 11.70 | +42.3% |
| Total comprehensive income (¥ million) | 3,221 | 1,444 | +123.0% |
| HOME'S segment revenue (¥ million) | 20,042 | 19,182 | +4.5% |
| HOME'S segment profit (¥ million) | 3,626 | 3,427 | +5.8% |
| Q3 revenue, Apr–Jun (¥ million) | 7,082 | 6,768 | +4.6% |
| Q3 operating profit, Apr–Jun (¥ million) | 894 | 1,176 | −24.0% |
| Operating cash flow (¥ million) | 3,579 | 3,256 | +9.9% |
| Total assets (period-end vs Sep 30, 2025) (¥ million) | 42,531 | 40,915 | +3.9% |
| Equity attrib. to owners (period-end vs Sep 30, 2025) (¥ million) | 27,991 | 26,022 | +7.6% |
| Equity ratio (period-end vs Sep 30, 2025) | 65.8% | 63.6% | +2.2 pt |
| FY9/2026 revenue guidance (¥ million) | 29,300 | — | +4.2% |
| FY9/2026 operating profit guidance (¥ million) | 3,900 | — | +2.2% |
| FY9/2026 net profit guidance (¥ million) | 2,500 | — | −53.0% |
| Annual dividend per share (¥; FY26 forecast vs FY25 actual) | 10.41 | 6.72 | +54.9% |
JapanStockPulse provides informational content only and does not constitute investment advice. Figures are taken from the company's published earnings short report and may be subject to subsequent revision.