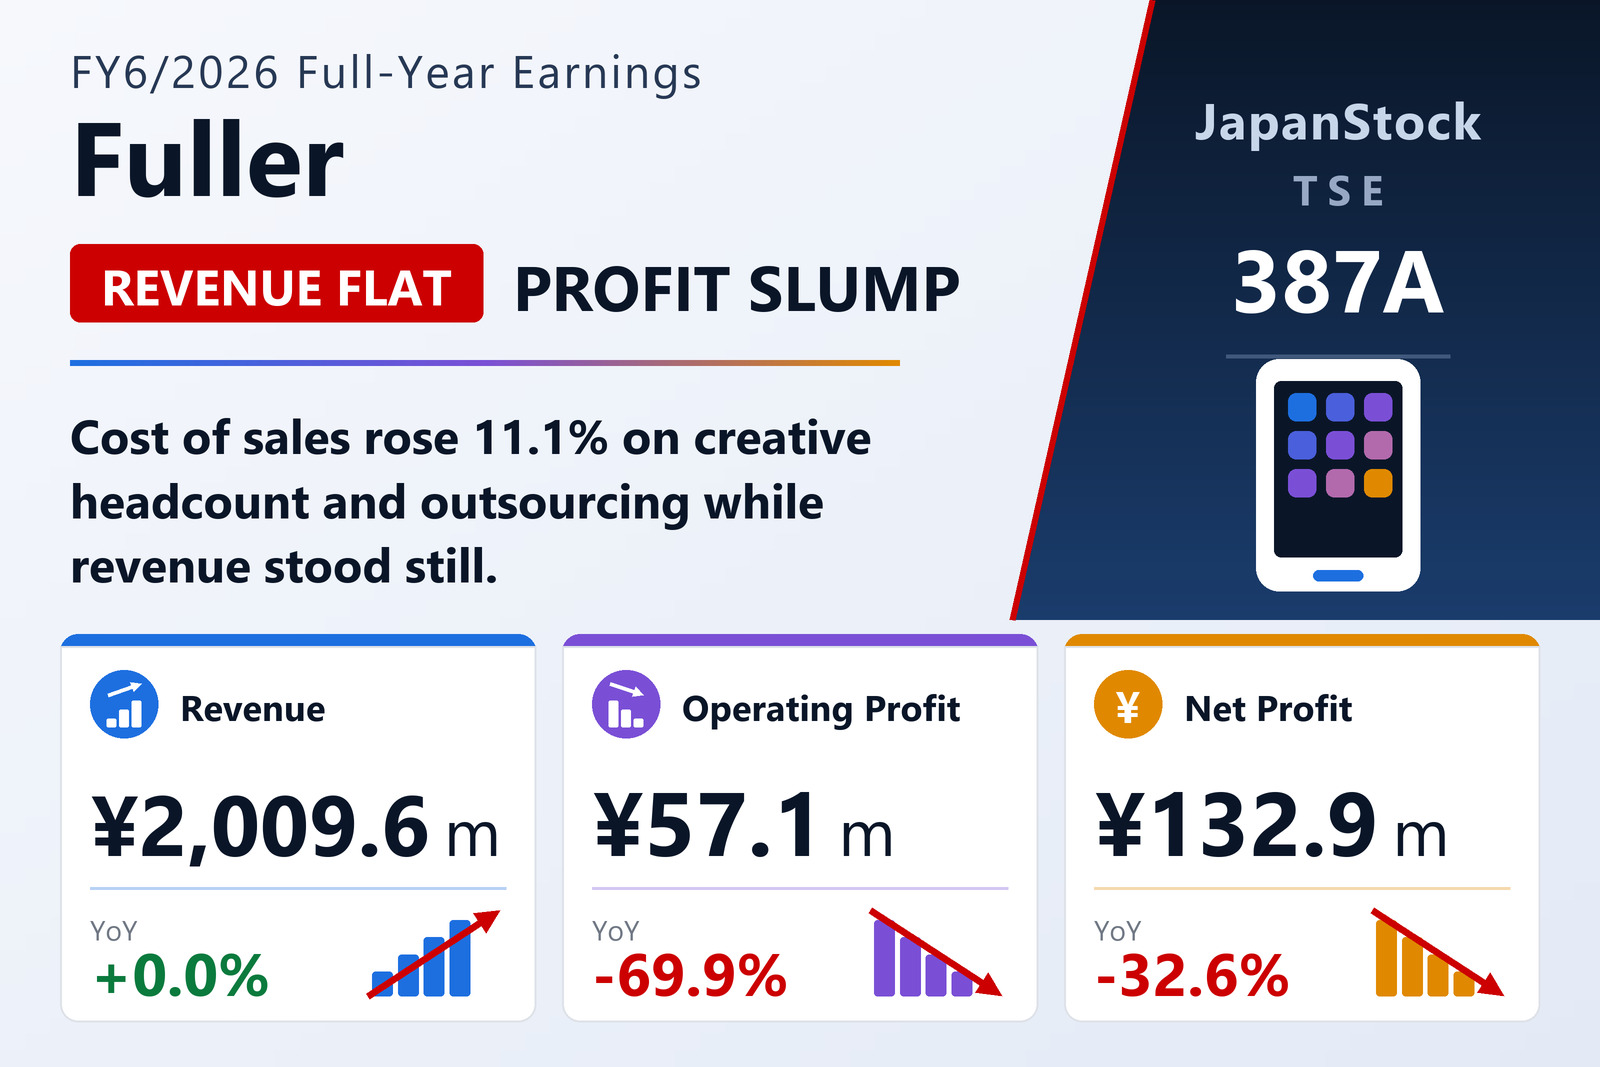
A flat top line meets an 11% cost increase
Fuller, Inc. (TSE: 387A) reported non-consolidated results for the full year ended June 30, 2026 under Japanese GAAP. Revenue was essentially unchanged at ¥2,009.6 million, up 0.0% — a gain of well under ¥1 million on the ¥2,009.0 million booked a year earlier, when the top line had grown 32.4%. Every line beneath it fell. Operating profit dropped 69.9% to ¥57.1 million from ¥189.7 million, ordinary profit fell 44.6% to ¥102.9 million from ¥185.7 million, and net income fell 32.6% to ¥132.9 million from ¥197.1 million. Basic earnings per share came to ¥77.93 against ¥121.98. Return on equity halved to 12.0% from 22.4% and the operating margin narrowed to 2.8% from 9.4%.
The company listed on the Tokyo Stock Exchange Growth market on July 24, 2025, three weeks into the fiscal year, so this is its first full year as a public company — and the first in which a diluted figure could be calculated. Diluted EPS of ¥77.50 was disclosed for the first time, using the average share price from the listing date to the year-end; the prior year carried no diluted figure because the shares were not yet traded.
The divergence between revenue and profit sits entirely on the cost side. Cost of sales rose 11.1% to ¥1,283.0 million as the company added creative staff and leaned harder on outsourcing, while revenue stood still. Gross profit therefore fell 14.9% to ¥726.5 million and the gross margin narrowed to 36.2% from 42.5%. Selling, general and administrative expenses were almost flat at ¥669.4 million, up 0.8%: the costs of the July 2025 listing and a larger sales team were offset by the absence of the listing-commemoration bonus booked in the prior year. With gross profit down ¥127.2 million and SG&A essentially unchanged, operating profit absorbed the entire decline.
The cost-of-sales schedule shows where the money went. Production labour costs rose 9.6% to ¥897.8 million, 69.4% of total manufacturing cost, while other production expenses rose 13.9% to ¥394.9 million, or 30.6%. Within the latter, outsourcing — the largest single non-labour item — increased to ¥250.4 million from ¥217.7 million.
A single segment, two revenue lines
Fuller runs one reportable segment, the Digital Partner business, and therefore publishes no segment breakdown. It does split the top line by service. Client work — the planning, design, development and operation of smartphone apps and other digital products — produced ¥1,907.8 million. A large development project wound down in the first half, temporarily depressing utilisation; several new development mandates began in the second half and utilisation recovered, leaving the full year roughly level. App analytics services built around the "App Ape" platform contributed ¥101.8 million, with user numbers broadly flat.
The company positions itself as a "digital partner" that carries a client through business planning, design, system development and operation, and data analysis in one engagement. Management notes that the software development market it serves has been expanding on the spread of generative AI and corporate digital transformation, with the smartphone-app segment holding up as one of DX's core fields.
A subsidy and a tax credit cushioned each line below operating profit
Each successive profit line fell by less than the one above it, and in both cases the cushion came from outside the trading result. Non-operating income of ¥60.2 million was dominated by a ¥57.3 million subsidy from Niigata Prefecture; non-operating expenses of ¥14.4 million comprised ¥9.4 million of listing-related costs, ¥4.4 million of interest and ¥0.6 million of share issuance costs. Ordinary profit therefore landed at ¥102.9 million — a 44.6% fall, materially shallower than operating profit's 69.9%.
Below that, an increase in deferred tax assets produced a deferred tax credit of ¥31.1 million. Against current income taxes of ¥1.1 million, total income taxes were a net credit of ¥30.0 million — so net income of ¥132.9 million finished above pre-tax profit of ¥102.9 million, and down only 32.6%. Neither the subsidy nor the tax credit is a recurring feature of the business, which is worth holding in mind against the guidance below.
Balance sheet strengthened; cash moved into a time deposit
Total assets edged down 0.5% to ¥1,825.7 million. Current assets fell ¥43.1 million to ¥1,610.2 million, with cash and deposits down ¥65.9 million, work in progress up ¥9.6 million and notes, accounts receivable and contract assets up ¥6.7 million. Non-current assets rose ¥34.0 million to ¥215.5 million, driven almost entirely by the ¥31.1 million increase in deferred tax assets, with tools, furniture and fixtures up ¥6.2 million and buildings up ¥1.0 million.
Liabilities fell ¥240.3 million to ¥604.8 million. Current liabilities dropped ¥83.3 million to ¥373.1 million as accrued expenses fell ¥48.2 million and accrued consumption taxes ¥40.8 million, partly offset by a ¥4.9 million rise in accounts payable. Non-current liabilities fell ¥157.0 million to ¥231.6 million, chiefly a ¥100.0 million reduction in long-term borrowings. Net assets rose ¥231.2 million to ¥1,221.0 million — ¥132.9 million of retained earnings plus ¥49.3 million each added to share capital and the capital reserve from share issuance. The equity ratio jumped to 66.9% from 53.9% and book value per share to ¥702.45 from ¥605.18.
Cash flow tells a different story from the profit line. Operating activities used ¥25.1 million, against ¥274.4 million generated a year earlier: pre-tax profit of ¥102.9 million was reduced by backing out the ¥57.3 million subsidy income, a ¥46.7 million fall in accrued expenses and a ¥40.9 million fall in accrued consumption taxes. Investing activities used ¥527.6 million, of which ¥500.0 million was simply placing a time deposit, alongside ¥24.7 million of property and equipment purchases and ¥11.1 million of lease and guarantee deposits. Financing used ¥13.2 million: ¥100.0 million of long-term debt repayment against ¥64.2 million raised from share issuance and ¥33.8 million from the exercise of share acquisition rights.
Cash and cash equivalents ended the year at ¥789.7 million, down ¥565.9 million. That headline understates the liquidity on hand: cash and deposits on the balance sheet stood at ¥1,289.7 million, and the ¥500.0 million gap is precisely the time deposit, which sits outside the definition of cash equivalents rather than having left the company.
Guidance issued as a range — and still no dividend
For FY6/2027 the company guides in a range rather than to a point, explicitly because future order intake carries uncertainty. Revenue is forecast at ¥2,600–2,720 million, up 29.4% to 35.4%; operating profit at ¥180–260 million, up 215.1% to 355.2%; ordinary profit at ¥180–260 million, up 74.9% to 152.6%; and net income at ¥130–190 million, a range running from a 2.2% decline to a 43.0% increase, for EPS of ¥74.79 to ¥109.30. The asymmetry is instructive: even a near-quadrupling of operating profit may leave net income below this year's figure, because this year's bottom line was flattered by the prefectural subsidy and the deferred tax credit.
Management bases the rebound on order flow already in hand — including the project described in its July 31, 2026 announcement regarding the receipt of a large order — and on a customer base it expects to widen as post-listing name recognition and creditworthiness improve. It also intends to expand business with its capital and business alliance partners, Yappli, Inc. and Dentsu Group Inc. and their group companies, through mutual client referrals and jointly delivered solutions. Recruitment of creative talent, both new graduates and mid-career hires, is expected to stay firm, and outsourcing will continue to supplement internal resources. The company plans to spend roughly ¥40 million on AI services in FY6/2027, accelerating AI use across the production process starting with engineers, on the view that efficiency gains translate directly into competitiveness and cost reduction.
No dividend was paid for FY6/2026, as none was for FY6/2025, and the FY6/2027 forecast is again ¥0.00. The annual general meeting is scheduled for September 28, 2026 and the securities report for September 29, 2026. The company reported no material subsequent events, and audit of this earnings report is not required.
| Metric | FY6/2026 | FY6/2025 | YoY |
|---|---|---|---|
| Revenue (¥ million) | 2,009.6 | 2,009.0 | +0.0% |
| — Client work (¥ million) | 1,907.8 | — | — |
| — App analytics, "App Ape" (¥ million) | 101.8 | — | — |
| Cost of sales (¥ million) | 1,283.0 | 1,155.3 | +11.1% |
| Gross profit (¥ million) | 726.5 | 853.7 | −14.9% |
| Gross margin | 36.2% | 42.5% | −6.3 pt |
| SG&A expenses (¥ million) | 669.4 | 664.0 | +0.8% |
| Operating profit (¥ million) | 57.1 | 189.7 | −69.9% |
| Operating margin | 2.8% | 9.4% | −6.6 pt |
| Ordinary profit (¥ million) | 102.9 | 185.7 | −44.6% |
| Net income (¥ million) | 132.9 | 197.1 | −32.6% |
| Basic EPS (¥) | 77.93 | 121.98 | −36.1% |
| Diluted EPS (¥) | 77.50 | — | — |
| Return on equity | 12.0% | 22.4% | −10.4 pt |
| Total assets (¥ million) | 1,825.7 | 1,834.8 | −0.5% |
| Net assets (¥ million) | 1,221.0 | 989.8 | +23.4% |
| Equity ratio | 66.9% | 53.9% | +13.0 pt |
| Book value per share (¥) | 702.45 | 605.18 | +16.1% |
| Operating cash flow (¥ million) | −25.1 | 274.4 | — |
| Cash and equivalents, year-end (¥ million) | 789.7 | 1,355.6 | −41.7% |
| Annual dividend per share (¥) | 0.00 | 0.00 | — |
| FY6/2027 revenue guidance (¥ million) | 2,600–2,720 | — | +29.4% to +35.4% |
| FY6/2027 operating profit guidance (¥ million) | 180–260 | — | +215.1% to +355.2% |
| FY6/2027 ordinary profit guidance (¥ million) | 180–260 | — | +74.9% to +152.6% |
| FY6/2027 net income guidance (¥ million) | 130–190 | — | −2.2% to +43.0% |
JapanStockPulse provides informational content only and does not constitute investment advice. Figures are taken from the company's published earnings short report and may be subject to subsequent revision.