Revenue up 18.0%, operating profit up 45.3% — and the margin gain came from overheads, not gross profit
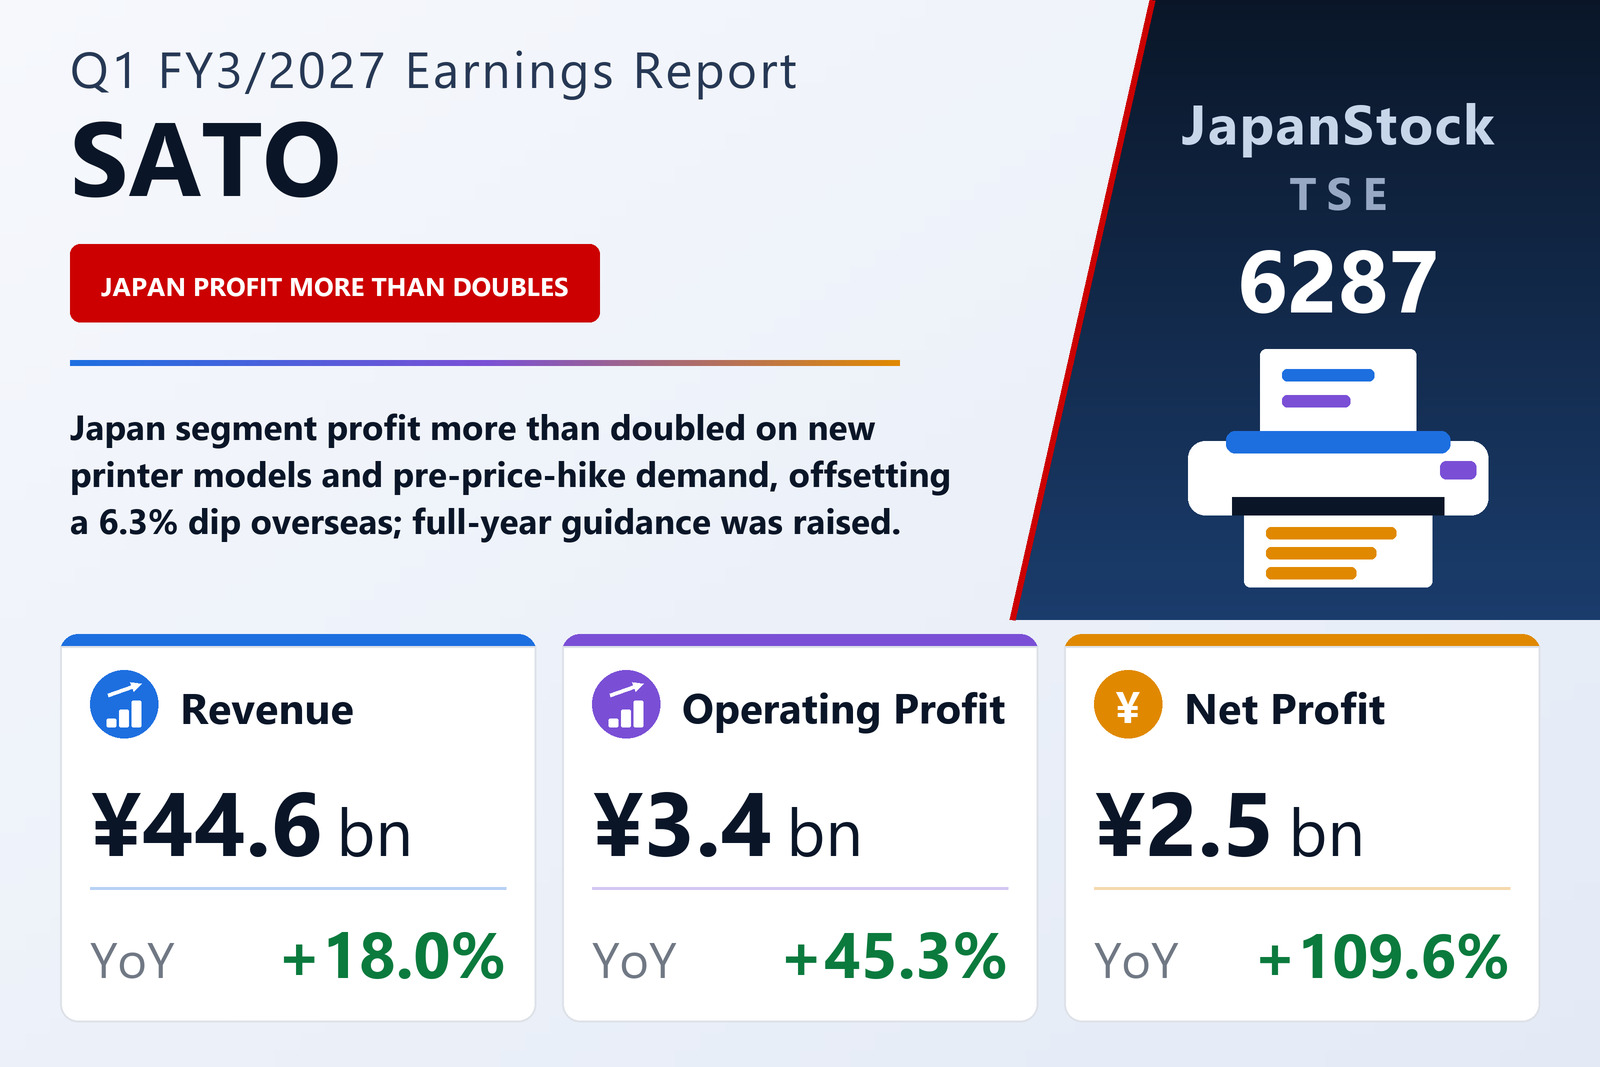
SATO Corporation (TSE: 6287), the automatic-identification solutions group that sells printers and label supplies in Japan and overseas, published consolidated first-quarter results for the three months from April 1 to June 30, 2026 on August 12, 2026 under Japanese GAAP. Revenue rose 18.0% to ¥44,621 million, operating profit 45.3% to ¥3,429 million, ordinary profit 72.1% to ¥3,245 million and profit attributable to owners of the parent 109.6% to ¥2,538 million, for earnings of ¥78.18 per share against ¥37.31. The filing names the Tokyo Stock Exchange as its listing venue.
The margin gain was not made at the gross line. Cost of sales rose 17.8% to ¥26,497 million, almost exactly in step with revenue, so gross profit grew 18.2% to ¥18,123 million and the gross margin barely moved, from 40.5% to 40.6%. The improvement came from overheads: selling, general and administrative expenses rose 13.3% to ¥14,694 million, nearly five points slower than revenue, and that spread alone lifted the operating margin from 6.2% to 7.7%. SG&A still grew by ¥1,721 million in absolute terms, and the filing attributes part of the increase in Japan to human-capital investment and one-off costs related to M&A.
Smaller non-operating charges widened the gain to 72% at the ordinary line
Ordinary profit grew faster than operating profit because non-operating expenses fell by almost half, to ¥390 million from ¥686 million. Foreign-exchange losses shrank to ¥67 million from ¥261 million, interest expense to ¥143 million from ¥203 million and a loss on net monetary position to ¥118 million from ¥153 million, while non-operating income was broadly flat at ¥206 million. Extraordinary items were negligible — ¥14 million of gains and ¥3 million of losses, against a prior-year quarter that carried ¥58 million of restructuring losses — so pre-tax profit reached ¥3,255 million, up 78.9%.
Income taxes rose only to ¥678 million from ¥557 million, a burden of about 20.8% of pre-tax profit against 30.6% a year earlier, which is why the bottom line grew faster still: profit attributable to owners of the parent more than doubled, to ¥2,538 million from ¥1,211 million. The filing does not explain the lower tax burden. Comprehensive income was ¥4,390 million, up 105.0%, and the foreign-currency translation adjustment on the balance sheet rose by ¥1,537 million over the quarter.
Japan more than doubled its profit; overseas grew revenue but earned less
SATO reports two segments, both in its automatic-identification solutions business. Japan posted external revenue of ¥22,858 million, up 19.7%, and segment profit of ¥1,850 million, up 114.0%. The filing says mechatronics revenue rose on higher printer sales following new-model launches, and that supplies revenue also rose — unevenly by market and industry — on demand pulled forward by the worsening situation in the Middle East and by price revisions. SG&A increased on human-capital investment and M&A-related one-off costs, but higher revenue and a better product mix more than covered it.
Overseas external revenue rose 16.1% to ¥21,762 million, but only 2.1% excluding currency effects, and segment profit fell 6.3% to ¥1,526 million. The base business was firm in every region, the filing says, while the companies specialising in primary labels lost revenue in local currency as competition in Europe, which had temporarily eased, returned to normal levels; the weaker yen turned that into growth in yen terms. On profit, the base business was held back by higher costs, including SG&A, in Europe and, in Asia and Oceania, by the end of the boost a large order had given factory margins a year earlier; the primary-label companies also earned less on higher European costs. The two segments' profit adds to ¥3,376 million, which the filing reconciles to consolidated operating profit of ¥3,429 million through a ¥52 million inventory adjustment.
An acquisition that is on the balance sheet but not yet in profit
During the quarter SATO acquired all voting shares of Hiranoya Bussan Co., Ltd., a maker and seller of packaging materials for food and daily-use products, on June 15, 2026, consolidating it together with its subsidiary. The company describes the deal as expanding its base in smart packaging, which it calls a new growth area within its Perfect and Unique Tagging concept. The purchase price was ¥2,119 million in cash, advisory and other acquisition-related costs were ¥215 million, and provisional goodwill of ¥843 million was recorded in the Japan segment, as the purchase-price allocation is not yet complete. Because the deemed acquisition date is June 30 and the acquired company has a December year-end, only its balance sheet was consolidated; none of its results are in this quarter's income statement.
Borrowings funded most of the growth in the balance sheet
Total assets rose 9.0% to ¥158,556 million from ¥145,459 million at March 31, 2026. Current assets grew by ¥7,627 million, mainly cash and deposits (+¥3,497 million) and receivables and contract assets (+¥1,711 million), and non-current assets by ¥5,469 million, mainly buildings and structures (+¥1,984 million) and goodwill (+¥839 million). Short-term borrowings rose by ¥5,284 million to ¥6,384 million and long-term borrowings by ¥2,693 million to ¥13,680 million, taking the two to ¥20,064 million from ¥12,086 million. Net assets rose only 3.5% to ¥92,747 million, on a ¥1,299 million increase in retained earnings and the translation adjustment, so the equity ratio fell from 58.6% to 55.6%.
Operating activities generated ¥2,206 million against ¥1,851 million a year earlier, even though income taxes paid rose to ¥1,463 million from ¥422 million. Investing activities used ¥2,559 million, including ¥889 million for the shares of the newly consolidated subsidiaries, ¥1,113 million for property, plant and equipment and ¥754 million for intangible assets. Financing activities brought in ¥3,421 million, chiefly a ¥5,116 million net increase in short-term borrowings less ¥1,214 million of dividends paid, and cash and cash equivalents ended the quarter at ¥29,721 million, up ¥3,286 million.
Guidance raised, and a buyback of up to ¥2,000 million approved the same day
SATO revised its FY3/2027 consolidated forecast in this filing, citing the quarter's performance trend. It now expects revenue of ¥172,000 million (+5.2%), up from a previous ¥168,500 million; operating profit of ¥12,100 million (+9.6%), from ¥11,700 million; ordinary profit of ¥11,600 million (+17.4%), from ¥11,200 million; and profit attributable to owners of ¥7,700 million (+51.4%), from ¥7,400 million, for earnings per share of ¥239.29. The first-half forecast is revenue of ¥86,100 million (+10.0%) and operating profit of ¥6,000 million (+17.6%). The full-year exchange-rate assumptions are ¥155 to the dollar and ¥180 to the euro.
The first quarter delivered 25.9% of guided full-year revenue, 28.3% of guided operating profit and 33.0% of guided net profit. Against the first-half forecast the shape is more pronounced: the ¥3,429 million just booked is 57.2% of the ¥6,000 million guided for the six months, implying second-quarter operating profit of about ¥2,571 million, below the first quarter, and the filing does not explain why. The dividend forecast is unchanged at ¥40.00 at each of the half-year and the year-end, an annual ¥80.00 against ¥76.00, up 5.3%. As a subsequent event, the board resolved on August 12, 2026 to buy back up to 1,000,000 shares — 3.1% of shares outstanding excluding treasury stock — for up to ¥2,000 million through market purchases on the Tokyo Stock Exchange between August 13, 2026 and February 26, 2027, and to cancel all shares so acquired on March 19, 2027, citing capital efficiency and shareholder returns.
| Metric | Q1 FY3/2027 | Q1 FY3/2026 | Change |
|---|---|---|---|
| Revenue (¥ million) | 44,621 | 37,829 | +18.0% |
| Gross profit (¥ million) | 18,123 | 15,332 | +18.2% |
| Gross margin | 40.6% | 40.5% | +0.1 pt |
| SG&A expenses (¥ million) | 14,694 | 12,973 | +13.3% |
| Operating profit (¥ million) | 3,429 | 2,359 | +45.3% |
| Operating margin | 7.7% | 6.2% | +1.5 pt |
| Ordinary profit (¥ million) | 3,245 | 1,885 | +72.1% |
| Net profit attrib. to owners of parent (¥ million) | 2,538 | 1,211 | +109.6% |
| Comprehensive income (¥ million) | 4,390 | 2,142 | +105.0% |
| EPS (¥) | 78.18 | 37.31 | +109.5% |
| Auto-ID Solutions (Japan) — revenue (¥ million) | 22,858 | 19,091 | +19.7% |
| Auto-ID Solutions (Japan) — segment profit (¥ million) | 1,850 | 864 | +114.0% |
| Auto-ID Solutions (Overseas) — revenue (¥ million) | 21,762 | 18,737 | +16.1% |
| Auto-ID Solutions (Overseas) — segment profit (¥ million) | 1,526 | 1,629 | −6.3% |
| Total assets (¥ million) | 158,556 | 145,459 | +9.0% |
| Net assets (¥ million) | 92,747 | 89,585 | +3.5% |
| Equity ratio | 55.6% | 58.6% | −3.0 pt |
| Short- and long-term borrowings (¥ million) | 20,064 | 12,086 | +66.0% |
| Operating cash flow (¥ million) | 2,206 | 1,851 | +19.2% |
| FY3/2027 guidance — revenue (¥ million) | 172,000 | — | +5.2% |
| FY3/2027 guidance — operating profit (¥ million) | 12,100 | — | +9.6% |
| FY3/2027 guidance — ordinary profit (¥ million) | 11,600 | — | +17.4% |
| FY3/2027 guidance — net profit (¥ million) | 7,700 | — | +51.4% |
| FY3/2027 guidance — EPS (¥) | 239.29 | — | — |
| Annual dividend per share (¥) | 80.00 | 76.00 | +5.3% |
JapanStockPulse provides informational content only and does not constitute investment advice. Figures are taken from the company's published earnings short report and may be subject to subsequent revision.