A growing book, a weaker quarter
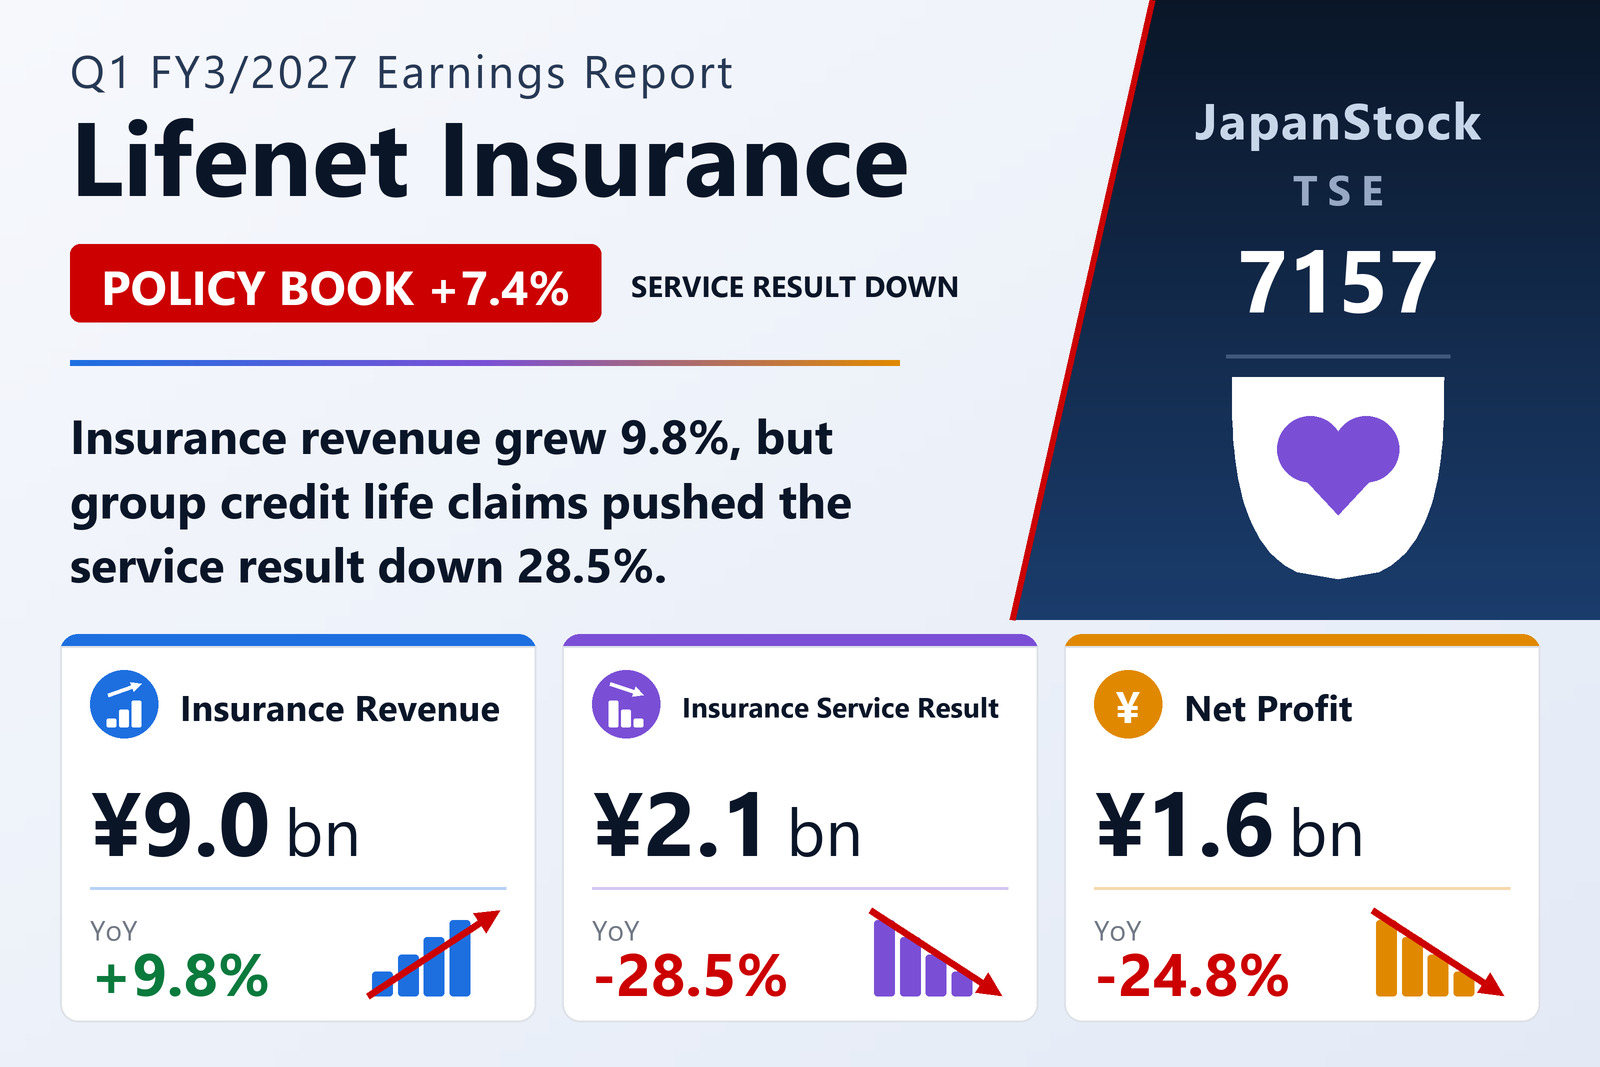
Lifenet Insurance Company (TSE: 7157), Japan's online-direct life insurer, reported consolidated results for the first quarter of the year to March 2027 — April 1 to June 30, 2026 — under IFRS. Insurance revenue rose 9.8% to ¥9,030 million and the annualised premium of policies in force reached ¥37,810 million, up 7.4% from a year earlier. But the insurance service result fell 28.5% to ¥2,104 million, profit before tax fell 24.8% to ¥2,303 million and profit attributable to owners of the parent fell 24.8% to ¥1,637 million. Basic earnings per share came to ¥20.38 against ¥27.11. Total comprehensive income swung to a loss of ¥917 million from income of ¥3,204 million. The results were published on August 12, 2026, with an online briefing for institutional investors and analysts the same evening.
None of those lines is a conventional industrial profit and loss. Under IFRS 17, insurance revenue is the release of expected claims and maintenance costs, of the risk adjustment for expired risk, and of contractual service margin as cover is actually provided; the insurance service result is what remains after insurance service expenses and the result on reinsurance held. The story of the quarter sits in the gap between the two halves of the business: the book expanded, and the earnings recognised on it did not.
Where the ¥841 million went
Insurance service expenses rose 42.5% to ¥6,995 million from ¥4,909 million, far outpacing the 9.8% rise in insurance revenue. Reinsurance moved the other way, contributing a positive ¥70 million against a negative ¥368 million a year earlier. Netted together, the service result fell to ¥2,104 million from ¥2,945 million.
The company attributes the decline to its group credit life business — the mortgage-linked cover it writes through banking partners — where claim and benefit payments increased and profit fell. The individual-insurance book's own service result eased to ¥2,376 million from ¥2,582 million, a decline of about 8%, while the group credit line swung from a service profit of roughly ¥731 million to a loss of about ¥342 million. Group credit premium volume is a fraction of the individual book, but claims on it are lumpy, and a single adverse quarter is enough to reverse the line.
Below the service result
The financial result was the quarter's bright spot, rising 76.7% to ¥323 million from ¥183 million as interest income from an enlarged corporate-bond portfolio increased; interest income alone was ¥358 million against ¥284 million. The residual "other result" — costs not directly attributable to insurance service, including product-development spending — widened to a negative ¥124 million from a negative ¥65 million. Profit before tax therefore came to ¥2,303 million, and an income-tax charge of ¥666 million left ¥1,637 million attributable to owners, an effective rate of 28.9%.
Acquisition spending kept pace with growth rather than being trimmed to protect the quarter. Insurance acquisition cash flows — the marketing, underwriting and systems costs directly attributable to writing new business — rose 7.9% to ¥2,748 million, and maintenance expenses rose 7.1% to ¥1,256 million.
The book itself is doing what it should
In-force annualised premium of ¥37,810 million was 1.4% higher than at March 31, 2026 as well as 7.4% higher than a year earlier. Individual insurance accounted for ¥29,176 million, up 1.6% over the quarter, and group credit life for ¥8,634 million, up 0.7%. Individual policies in force reached 698,946, up 1.9% in three months. New business was stronger still: new-business annualised premium rose 6.5% to ¥844 million on 22,244 new policies, up 11.4%. The surrender-and-lapse rate improved to 5.2% from 5.6%.
The composition of insurance revenue shows how that book converts into reported income. Individual insurance produced ¥6,891 million of the ¥9,030 million total and group credit life ¥2,138 million. Within the individual figure, expected claims and maintenance costs accounted for ¥3,192 million, contractual service margin recognised for services provided for ¥2,029 million, and the release of risk adjustment for expired risk for ¥419 million. The individual-insurance contractual service margin — unearned profit that will be recognised as cover is provided in future periods — stood at ¥97,138 million at June 30, little changed from ¥97,385 million three months earlier.
A comprehensive loss, and a stronger solvency ratio
Total assets fell 1.4% to ¥120,166 million from ¥121,834 million at March 31, 2026. Investment securities, mainly highly rated government and corporate bonds, stood at ¥72,821 million and insurance contract assets at ¥27,534 million — the individual-insurance contract liability is negative (a ¥141,751 million present value of future cash flows against a ¥17,086 million risk adjustment and ¥97,138 million of CSM, for ¥−27,527 million in total), so it is carried as an asset rather than a liability. Liabilities fell to ¥25,483 million from ¥26,223 million, of which deferred tax liabilities were ¥20,492 million.
Equity attributable to owners eased to ¥94,683 million from ¥95,600 million, while the equity ratio rose to 78.8% from 78.5%. The decline is entirely the comprehensive loss: retained earnings gained ¥1,637 million, exactly the quarter's profit, while other components of equity fell to ¥−7,754 million from ¥−5,200 million as after-tax other comprehensive income came in at ¥−2,554 million, driven by fair-value declines on financial assets and by insurance finance movements. That is the arithmetic that turns ¥1,637 million of profit into a ¥917 million comprehensive loss.
Regulatory capital moved the other way. Under the economic-value-based solvency regime introduced from the end of March 2026, the economic solvency ratio was 339% at June 30 against 333.7% at March 31, and the company's internally adjusted ESR was 402% against 394.5%; both figures are described as provisional. Comprehensive capital — Lifenet's own headline value metric, which adds tax-adjusted CSM and the value of the group credit book to IFRS equity — was ¥174,854 million, 0.7% below the ¥176,149 million recorded at March 31 (IFRS equity ¥94,683 million, tax-adjusted CSM ¥65,116 million, group credit contract value ¥15,054 million). The medium-term plan targets ¥200–240 billion of comprehensive capital by fiscal 2028.
Guidance untouched, no dividend
Full-year guidance for FY3/2027, first published on May 13, 2026, is unchanged: in-force annualised premium of ¥41,300 million (+10.8%), insurance revenue of ¥37,500 million (+9.0%), an insurance service result of ¥11,200 million (−3.5%) and profit attributable to owners of ¥8,200 million (+2.0%). The plan already assumed a mild decline in the service result for the year, so a soft first quarter is not by itself a break with the forecast — and the quarter's ¥1,637 million represents 20.0% of the full-year profit target. Within the in-force guidance, individual insurance is expected to reach ¥30,800 million and group credit life ¥10,500 million.
No dividend is forecast. The company guides to ¥0.00 for FY3/2027, unchanged from its previous forecast and matching FY3/2026's nil payout. The shape of the group changed during the quarter: Lifenet sold its entire stake in subsidiary Lifenet Mirai Inc., leaving it with no subsidiaries at all, yet it continues to prepare consolidated statements because a money trust it operates for investment purposes qualifies as a controlled structured entity under IFRS 10. The business remains a single life-insurance segment, the quarterly statements were not reviewed by an accounting auditor, depreciation and amortisation was ¥270 million against ¥257 million, and the company reported no material subsequent events.
| Metric | Q1 FY3/2027 | Q1 FY3/2026 | YoY |
|---|---|---|---|
| Annualised premium of policies in force (¥ million) | 37,810 | 35,214 | +7.4% |
| Insurance revenue (¥ million) | 9,030 | 8,222 | +9.8% |
| Insurance service expenses (¥ million) | 6,995 | 4,909 | +42.5% |
| Net result from reinsurance contracts held (¥ million) | 70 | −368 | n.m. |
| Insurance service result (¥ million) | 2,104 | 2,945 | −28.5% |
| Financial result (¥ million) | 323 | 183 | +76.7% |
| Other result (¥ million) | −124 | −65 | n.m. |
| Profit before tax (¥ million) | 2,303 | 3,063 | −24.8% |
| Profit attrib. to owners of parent (¥ million) | 1,637 | 2,177 | −24.8% |
| Basic EPS (¥) | 20.38 | 27.11 | −24.8% |
| Total comprehensive income (¥ million) | −917 | 3,204 | n.m. |
| Insurance acquisition cash flows (¥ million) | 2,748 | 2,547 | +7.9% |
| New-business annualised premium (¥ million) | 844 | — | +6.5% |
| New policies, individual insurance | 22,244 | — | +11.4% |
| Surrender and lapse rate | 5.2% | 5.6% | −0.4 pt |
| Total assets (¥ million; vs Mar 31, 2026) | 120,166 | 121,834 | −1.4% |
| Equity attrib. to owners (¥ million; vs Mar 31, 2026) | 94,683 | 95,600 | −1.0% |
| Equity ratio (vs Mar 31, 2026) | 78.8% | 78.5% | +0.3 pt |
| Economic solvency ratio (ESR; vs Mar 31, 2026) | 339% | 333.7% | +5.3 pt |
| Comprehensive capital (¥ million; vs Mar 31, 2026) | 174,854 | 176,149 | −0.7% |
| FY3/2027 in-force premium guidance (¥ million) | 41,300 | 37,290 | +10.8% |
| FY3/2027 insurance revenue guidance (¥ million) | 37,500 | 34,388 | +9.0% |
| FY3/2027 insurance service result guidance (¥ million) | 11,200 | 11,606 | −3.5% |
| FY3/2027 net profit guidance (¥ million) | 8,200 | 8,041 | +2.0% |
| Annual dividend per share (¥; FY26 forecast vs FY25 actual) | 0.00 | 0.00 | Unchanged |
JapanStockPulse provides informational content only and does not constitute investment advice. Figures are taken from the company's published earnings short report and may be subject to subsequent revision.