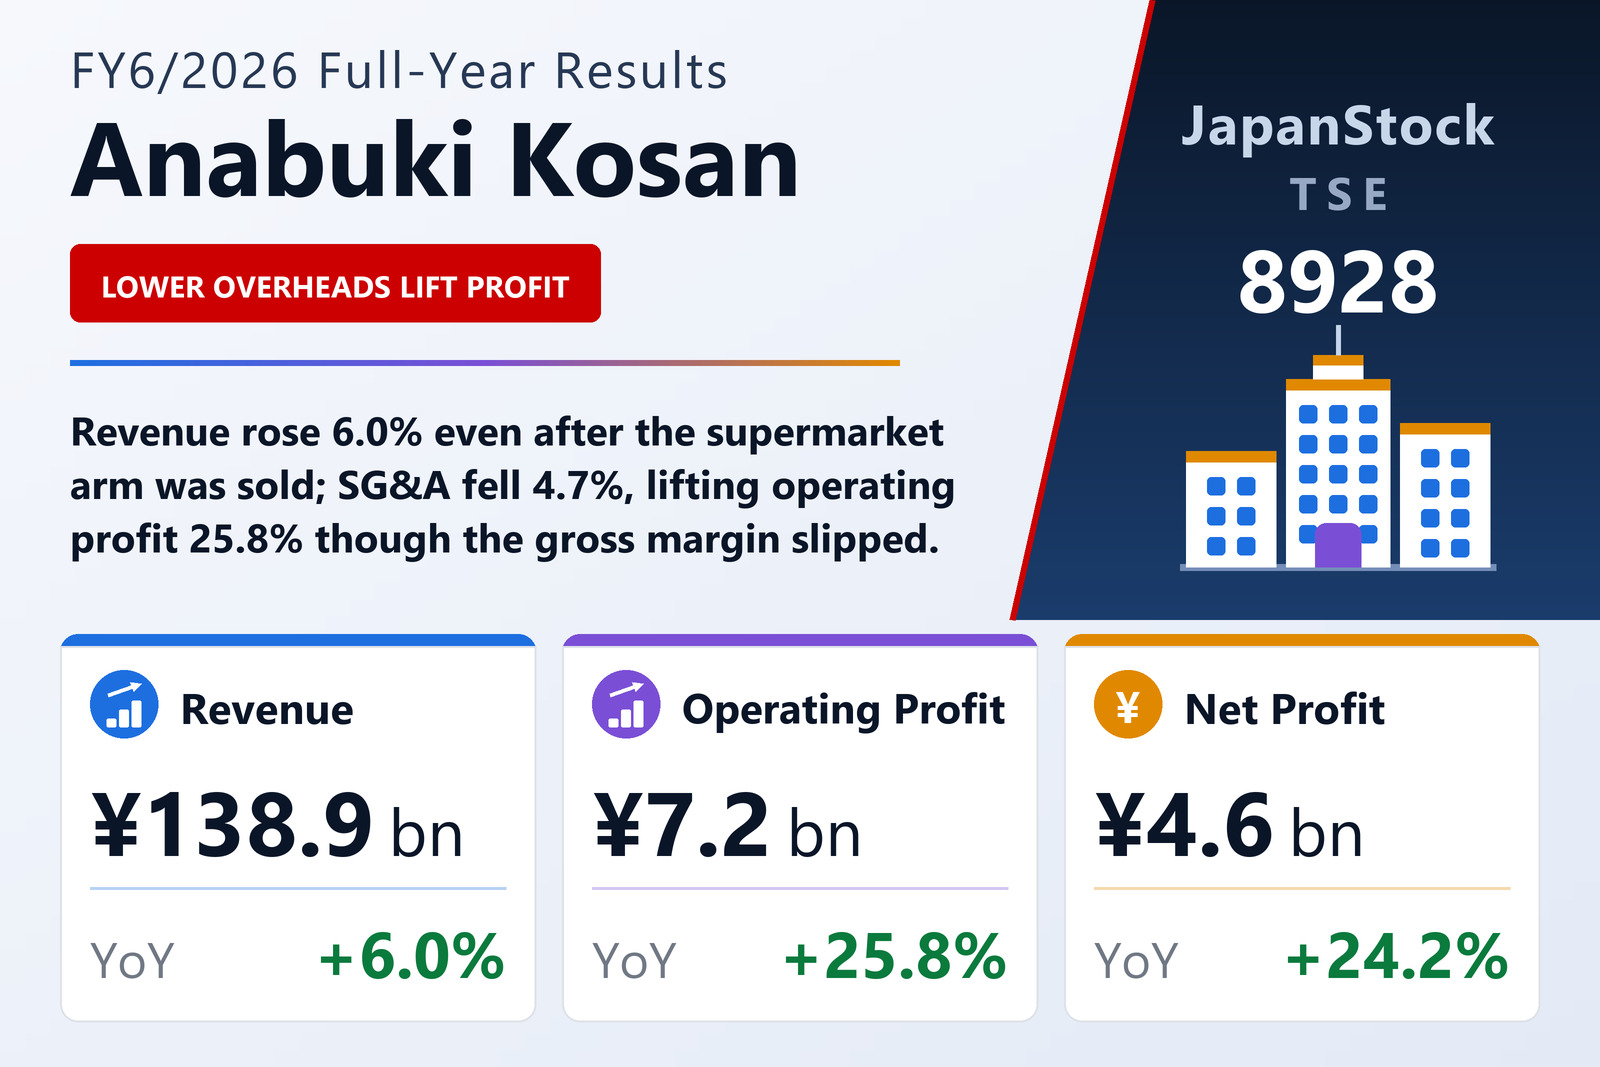
Revenue up 6.0% even after the supermarket business left the group
Anabuki Kosan Inc. (TSE: 8928), a condominium developer whose group also runs staffing, facility-operation, nursing-care, energy and travel businesses, published consolidated results for the fiscal year from July 1, 2025 to June 30, 2026 on August 12, 2026 under Japanese GAAP. Revenue rose 6.0% to ¥138,877 million, operating profit 25.8% to ¥7,157 million, ordinary profit 36.9% to ¥7,689 million and profit attributable to owners of the parent 24.2% to ¥4,621 million, for earnings of ¥433.28 per share against ¥348.98.
The revenue comparison carries a change of scope. On July 1, 2025, the first day of the year, the company sold all the shares of the consolidated subsidiary that ran its supermarket business, and the Retail segment was abolished. A year earlier that segment had recorded external sales of ¥7,596 million and a segment loss of ¥193 million. The group therefore added ¥7,904 million of revenue while giving up a business of almost that size, and every one of its six remaining reportable segments grew its sales.
The gross margin slipped; lower overheads carried operating profit
The profit gain did not come from gross margin. Cost of sales rose 7.1% to ¥112,141 million, faster than revenue, so gross profit rose only 1.9% to ¥26,735 million and the gross margin eased from 20.0% to 19.3%. What moved the operating line was selling, general and administrative expenses, which fell 4.7% to ¥19,577 million from ¥20,541 million. That reduction of ¥964 million, added to ¥503 million more gross profit, accounts for the ¥1,467 million rise in operating profit, and the operating margin widened from 4.3% to 5.2%. The filing does not explain the fall in SG&A; it coincides with the departure of the supermarket business, but the company does not connect the two.
Below the operating line: a currency gain, a provision reversal and heavier interest
Ordinary profit grew faster than operating profit because the non-operating balance swung from a net expense of about ¥71 million to net income of about ¥531 million. The statements show a ¥455 million foreign-exchange gain against a ¥33 million loss a year earlier and a ¥384 million reversal of the allowance for doubtful accounts against ¥49 million, partly offset by subsidy income falling to ¥563 million from ¥750 million and interest expense rising 28.2% to ¥1,034 million. Extraordinary items then took a net ¥166 million: gains of ¥175 million, almost entirely on sales of fixed assets, against losses of ¥342 million, including impairment losses of ¥223 million, a ¥57 million loss on the sale of affiliate shares and a ¥53 million write-down of investment securities.
Pre-tax profit was ¥7,523 million, up 35.1%, but income taxes rose 56.3% to ¥2,886 million, lifting the effective tax rate to about 38% from about 33%, which is why profit attributable to owners grew a more modest 24.2%. Comprehensive income was ¥4,817 million, up 27.2%.
Real estate carries the revenue; energy and facilities carry the profit growth
Real Estate, the core segment, lifted external sales 12.1% to ¥103,511 million but segment profit only 2.6% to ¥5,593 million. New condominium units booked as revenue fell 5.9% to 1,739 and contracts fell 3.2% to 1,595, while the company delivered 11 whole-building Glorio rental condominiums, a series it develops mainly in the Tokyo metropolitan area, against 10. It describes investor demand for investment property as strong on inbound tourism and the weak yen, and the new-condominium market as still calling for caution because of high prices, expected mortgage-rate rises and higher land and construction costs. At the year-end it had already contracted 1,470 units for revenue in FY6/2027 or later, and unsold completed stock was only 15 units, all in projects shared with other developers. The used-condominium buy-and-resell business held 1,117 units, 1.6% fewer.
The smaller segments moved more sharply. Energy, which supplies electricity to condominiums through bulk high-voltage purchasing, raised sales 17.3% to ¥9,576 million and swung to a segment profit of ¥815 million from a ¥70 million loss, helped by weather-driven higher power use, lower procurement costs and electrical-construction orders; it now serves 62,025 units in 952 buildings. Facility Operation, led by hotels and expressway service areas, grew sales 14.5% to ¥8,843 million and more than tripled profit to ¥325 million, with the filing citing Expo 2025 Osaka, Kansai and the Setouchi Triennale 2025. Human Resources Services grew sales 8.0% to ¥6,405 million and profit 52.6% to ¥414 million, and Nursing Care & Medical grew sales 9.5% to ¥7,644 million and profit 23.6% to ¥238 million across 39 facilities with 1,783 rooms. Tourism grew sales 7.3% to ¥2,259 million but slipped to a ¥2 million loss from a ¥39 million profit as transport and lodging costs rose.
An inventory build absorbed cash, and borrowing funded it
Total assets rose 6.1% to ¥157,214 million at June 30, 2026, mainly because real estate for sale rose ¥5,655 million to ¥48,125 million; real estate in progress also rose, to ¥62,803 million from ¥58,814 million. Net assets rose 9.4% to ¥47,764 million and the equity ratio improved from 29.4% to 30.3%. Operating cash flow was an outflow of ¥4,537 million against an inflow of ¥55 million, mainly because inventories increased by ¥9,718 million; investing activities used ¥1,642 million, mainly for capital contributions, and financing activities brought in ¥5,525 million, mainly from long-term borrowings. Cash ended the year at ¥6,635 million, down ¥336 million.
Guidance: operating profit up, net profit down without the currency gain
For FY6/2027 the company forecasts revenue of ¥145,000 million (+4.4%), operating profit of ¥7,700 million (+7.6%), ordinary profit of ¥7,000 million (−9.0%) and profit attributable to owners of ¥4,500 million (−2.6%), or ¥421.87 per share. It attributes the expected declines in ordinary and net profit mainly to the ¥455 million foreign-exchange gain booked in FY6/2026. Guided ordinary profit sits ¥700 million below guided operating profit, implying a net non-operating expense again after this year's net income.
The annual dividend for FY6/2026 was raised to ¥78.00 from ¥58.00, made up of ¥32.00 at the interim and ¥46.00 at the year-end, for a payout ratio of 18.0% against 16.6%, with payment due to begin on September 30, 2026. For FY6/2027 the company forecasts ¥80.00, split ¥40.00 and ¥40.00, for a payout ratio of 19.0%.
| Metric | FY6/2026 | FY6/2025 | Change |
|---|---|---|---|
| Revenue (¥ million) | 138,877 | 130,973 | +6.0% |
| Gross profit (¥ million) | 26,735 | 26,232 | +1.9% |
| Gross margin | 19.3% | 20.0% | −0.7 pt |
| SG&A expenses (¥ million) | 19,577 | 20,541 | −4.7% |
| Operating profit (¥ million) | 7,157 | 5,690 | +25.8% |
| Operating margin | 5.2% | 4.3% | +0.9 pt |
| Ordinary profit (¥ million) | 7,689 | 5,618 | +36.9% |
| Pre-tax profit (¥ million) | 7,523 | 5,567 | +35.1% |
| Net profit attrib. to owners of parent (¥ million) | 4,621 | 3,722 | +24.2% |
| Comprehensive income (¥ million) | 4,817 | 3,788 | +27.2% |
| EPS (¥) | 433.28 | 348.98 | +24.2% |
| Real Estate — revenue (¥ million) | 103,511 | 92,363 | +12.1% |
| Real Estate — segment profit (¥ million) | 5,593 | 5,453 | +2.6% |
| Human Resources Services — revenue (¥ million) | 6,405 | 5,932 | +8.0% |
| Human Resources Services — segment profit (¥ million) | 414 | 271 | +52.6% |
| Facility Operation — revenue (¥ million) | 8,843 | 7,725 | +14.5% |
| Facility Operation — segment profit (¥ million) | 325 | 96 | +237.0% |
| Nursing Care & Medical — revenue (¥ million) | 7,644 | 6,982 | +9.5% |
| Nursing Care & Medical — segment profit (¥ million) | 238 | 192 | +23.6% |
| Energy — revenue (¥ million) | 9,576 | 8,165 | +17.3% |
| Energy — segment profit (¥ million) | 815 | −70 | loss to profit |
| Tourism — revenue (¥ million) | 2,259 | 2,106 | +7.3% |
| Tourism — segment profit (¥ million) | −2 | 39 | profit to loss |
| Total assets (¥ million) | 157,214 | 148,139 | +6.1% |
| Net assets (¥ million) | 47,764 | 43,653 | +9.4% |
| Equity ratio | 30.3% | 29.4% | +0.9 pt |
| Operating cash flow (¥ million) | −4,537 | 55 | n.m. |
| FY6/2027 guidance — revenue (¥ million) | 145,000 | — | +4.4% |
| FY6/2027 guidance — operating profit (¥ million) | 7,700 | — | +7.6% |
| FY6/2027 guidance — ordinary profit (¥ million) | 7,000 | — | −9.0% |
| FY6/2027 guidance — net profit (¥ million) | 4,500 | — | −2.6% |
| FY6/2027 guidance — EPS (¥) | 421.87 | — | −2.6% |
| Annual dividend per share (¥) | 80.00 | 78.00 | +2.6% |
| Annual dividend per share, FY6/2026 (¥) | 78.00 | 58.00 | +34.5% |
JapanStockPulse provides informational content only and does not constitute investment advice. Figures are taken from the company's published earnings short report and may be subject to subsequent revision.