A quiet COVID season took nearly a quarter off the top line
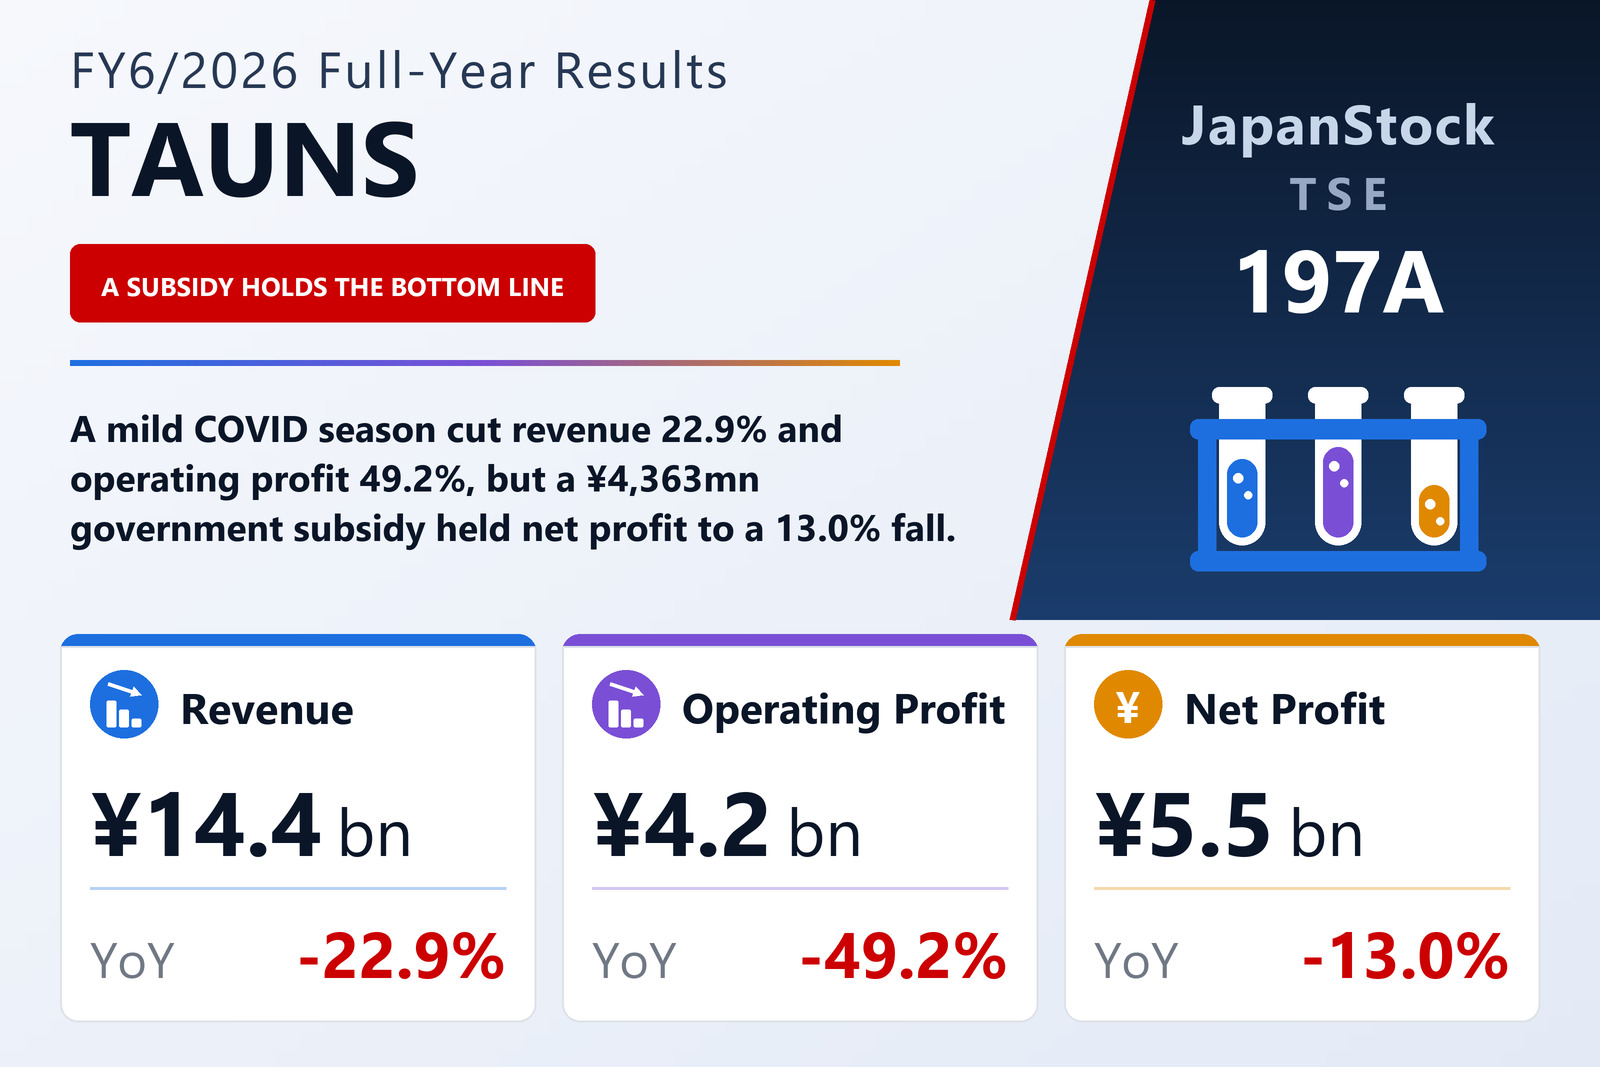
TAUNS Co., Ltd. (TSE: 197A), the Shizuoka-based maker of in-vitro diagnostic reagents and rapid test kits, published non-consolidated results for the year to June 30, 2026 on August 13, 2026 under Japanese GAAP. Revenue fell 22.9% to ¥14,369 million, operating profit 49.2% to ¥4,200 million and ordinary profit 51.9% to ¥3,952 million. Net profit fell only 13.0% to ¥5,495 million, for earnings per share of ¥52.28 against ¥62.07. The company reports a single segment, in-vitro diagnostics, so the whole business moves together.
The demand mix flipped. The influenza season began unusually early, in late September, and ran for a long stretch, while COVID-19 circulated at a level far below the prior year. Because coronavirus-linked products are the larger part of the book, that change cost revenue: COVID-19 single-test kits fell 28.7% to ¥3,460 million, COVID-19/influenza combination kits 30.2% to ¥5,529 million and influenza kits 18.6% to ¥2,697 million, with only other products higher, up 5.7% to ¥2,682 million. Lower volume against a largely fixed cost base pushed the gross margin down 7.2 points to 61.4% and the operating margin down 15.2 points to 29.2% — which is why operating profit fell roughly twice as fast as revenue.
The bottom line is standing on a subsidy that will not repeat
Net profit fell far less than the lines above it for one reason: the company recorded a government subsidy of ¥4,363 million in extraordinary income. Pre-tax profit was therefore ¥7,895 million against ¥8,201 million, down only 3.7%, and the net margin rose to 38.2% from 33.9% even as the operating margin collapsed. Without that subsidy the year's net profit would have looked nothing like ¥5,495 million. Earnings per share fell 15.8%, slightly faster than net profit, because the average share count rose about 3.3% to 105,104,210 on the exercise of share acquisition rights. Return on equity fell to 29.8% from 40.7%, and ordinary profit to total assets to 9.7% from 25.0%.
That is also why the FY6/2027 guidance reads the way it does. The company expects revenue of ¥16,730 million (+16.4%), operating profit of ¥4,374 million (+4.1%) and ordinary profit of ¥4,026 million (+1.9%) — but net profit of ¥2,965 million, down 46.0%, for earnings per share of ¥27.80. The operating line recovers; the bottom line halves, because the subsidy does not repeat. The annual dividend is guided up to ¥29.00 from ¥28.00, split ¥14.50 interim and ¥14.50 final, which against the reduced profit forecast implies a payout ratio of 104.3%, up from 53.6% this year. The company manages the business on an annual basis and publishes no first-half forecast.
A new plant, funded with debt, has drained the cash
The balance sheet grew hard. Total assets rose ¥8,105 million to ¥44,620 million as the new factory formally entered operation, lifting buildings and machinery, with trade receivables and investment securities also higher. Liabilities rose ¥6,102 million to ¥25,200 million, mainly long-term borrowings raised to fund the plant, and net assets rose ¥2,002 million to ¥19,420 million, largely through the fixed-asset compression reserve booked against the subsidy. The equity ratio fell to 43.5% from 47.7% even so, while book value per share rose to ¥182.01 from ¥168.99.
Cash tells the harder story. Operating cash flow swung to an outflow of ¥2,825 million from an inflow of ¥6,818 million — a ¥9,643 million reversal the company attributes to higher trade receivables, a ¥1,145 million consumption-tax refund receivable and lower trade payables. Investing absorbed a further ¥6,175 million on fixed assets and investment securities, and although financing brought in ¥3,297 million after ¥3,749 million of dividends paid, cash and equivalents fell to ¥3,563 million from ¥9,266 million. One counterweight: the fourth quarter was a recovery. Revenue was ¥3,705 million, up 263.3% against a prior-year quarter depressed by channel-inventory adjustment, the fourth-quarter gross margin was 48.0% against 8.8%, and fourth-quarter operating profit was ¥690 million against a ¥1,065 million loss. In July 2026 the company also won approval for ImmunoAce® SARS-CoV-2/Flu II, a combination kit that cuts read time from 15 minutes to 10 and extends shelf life from 12 months to 22, and it is pushing distribution through a co-promotion with Shionogi & Co., Ltd. — while assuming some decline in unit selling prices.
| Metric | FY6/2026 | FY6/2025 | Change |
|---|---|---|---|
| Revenue (¥ million) | 14,369 | 18,627 | −22.9% |
| Gross profit (¥ million) | 8,821 | 12,774 | −30.9% |
| Gross margin | 61.4% | 68.6% | −7.2 pt |
| Operating profit (¥ million) | 4,200 | 8,265 | −49.2% |
| Operating margin | 29.2% | 44.4% | −15.2 pt |
| Ordinary profit (¥ million) | 3,952 | 8,219 | −51.9% |
| Government subsidy in extraordinary income (¥ million) | 4,363 | — | new |
| Pre-tax profit (¥ million) | 7,895 | 8,201 | −3.7% |
| Net profit (¥ million) | 5,495 | 6,315 | −13.0% |
| Net margin | 38.2% | 33.9% | +4.3 pt |
| EPS (¥) | 52.28 | 62.07 | −15.8% |
| Diluted EPS (¥) | 51.08 | 58.90 | −13.3% |
| Return on equity | 29.8% | 40.7% | −10.9 pt |
| COVID-19 test kits (¥ million) | 3,460 | 4,854 | −28.7% |
| COVID-19/influenza combination kits (¥ million) | 5,529 | 7,921 | −30.2% |
| Influenza test kits (¥ million) | 2,697 | 3,314 | −18.6% |
| Other products (¥ million) | 2,682 | 2,537 | +5.7% |
| Fourth-quarter revenue (¥ million) | 3,705 | 1,020 | +263.3% |
| Total assets (¥ million) | 44,620 | 36,515 | +22.2% |
| Net assets (¥ million) | 19,420 | 17,417 | +11.5% |
| Equity ratio | 43.5% | 47.7% | −4.2 pt |
| Book value per share (¥) | 182.01 | 168.99 | +7.7% |
| Operating cash flow (¥ million) | −2,825 | 6,818 | n.m. |
| Cash and equivalents at year end (¥ million) | 3,563 | 9,266 | −61.5% |
| FY6/2027 guidance — revenue (¥ million) | 16,730 | — | +16.4% |
| FY6/2027 guidance — operating profit (¥ million) | 4,374 | — | +4.1% |
| FY6/2027 guidance — ordinary profit (¥ million) | 4,026 | — | +1.9% |
| FY6/2027 guidance — net profit (¥ million) | 2,965 | — | −46.0% |
| FY6/2027 guidance — EPS (¥) | 27.80 | — | n.m. |
| Annual dividend per share (¥) | 29.00 | 28.00 | +3.6% |
JapanStockPulse provides informational content only and does not constitute investment advice. Figures are taken from the company's published earnings short report and may be subject to subsequent revision.