A near-doubling of revenue, and the asterisk attached to it
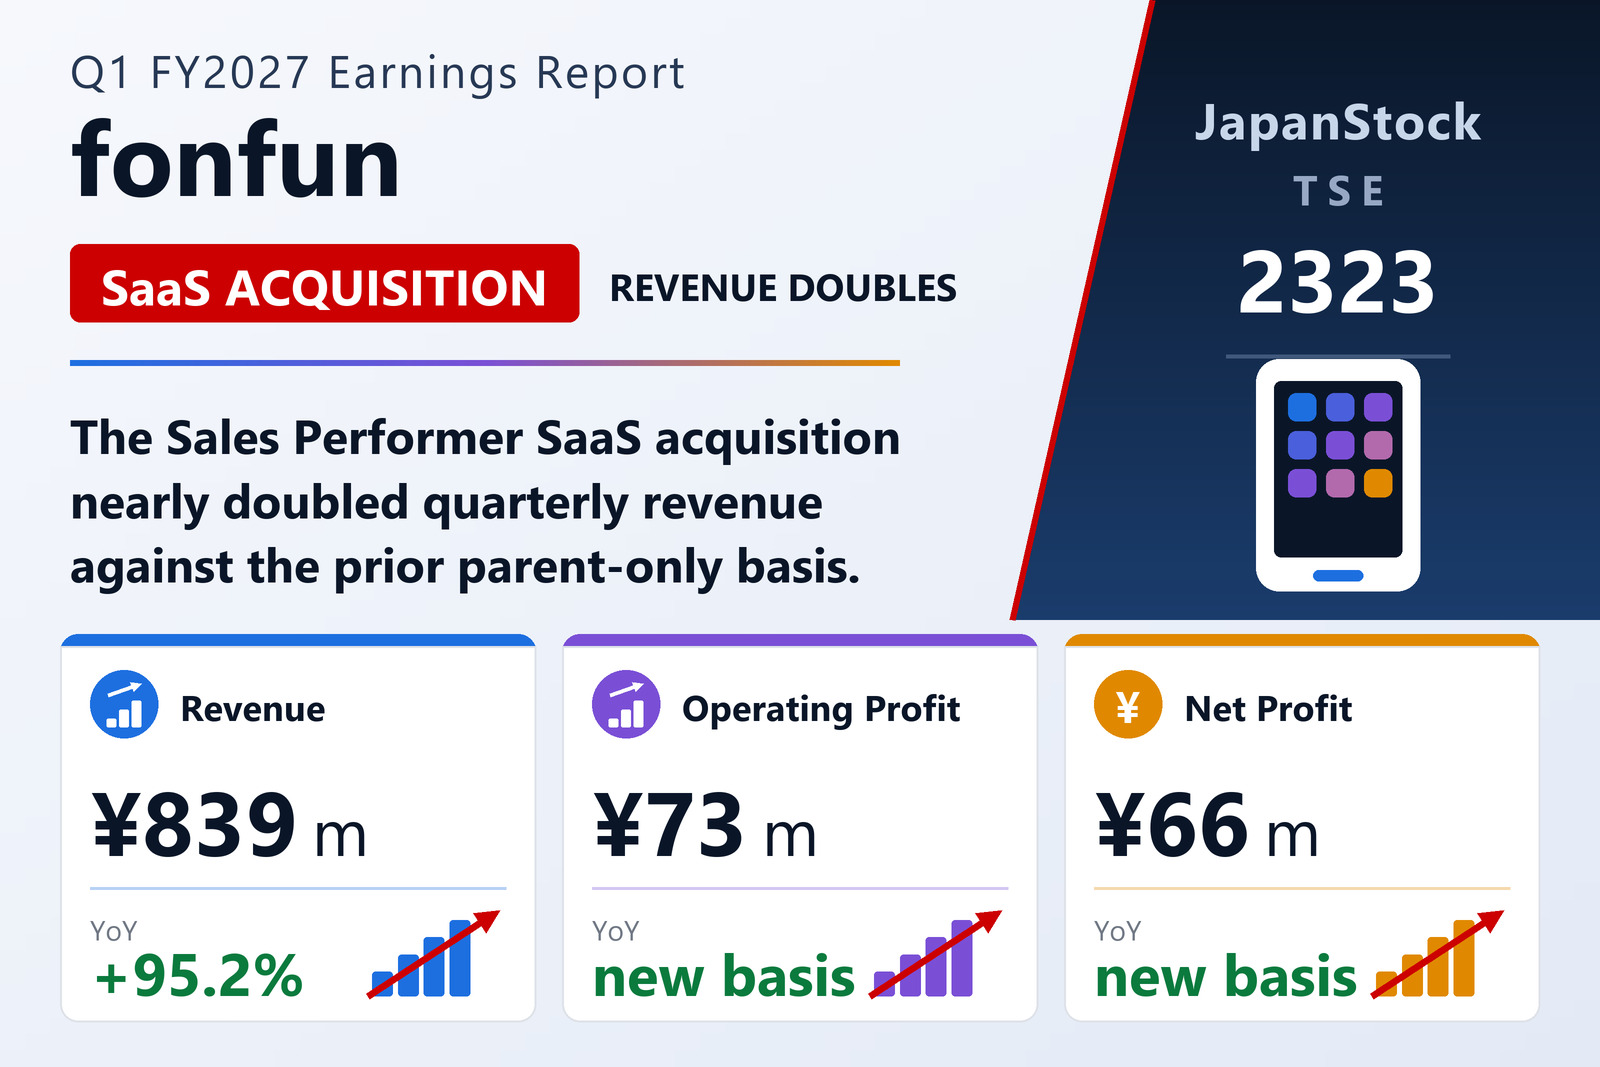
fonfun corporation (TSE: 2323), the Tokyo Stock Exchange Standard-listed IT services group led by President Tsubasa Mizuguchi and run under the mission "Make society smarter with technology," disclosed consolidated results for the first quarter of the year to March 2027 — April 1 to June 30, 2026 — under Japanese GAAP on August 13, 2026. Revenue came in at ¥839 million, adjusted operating profit (EBITDA) at ¥156 million, operating profit at ¥73 million, ordinary profit at ¥60 million and net profit attributable to owners of parent at ¥66 million. Basic earnings per share were ¥3.15 and diluted EPS ¥3.09. Comprehensive income was ¥66 million, matching net profit — there were no other comprehensive income items of note in the quarter.
The headline growth figure needs handling with care, and the company says so itself. fonfun only began preparing consolidated quarterly financial statements from the third quarter of FY3/2026. There is therefore no comparable consolidated quarter a year earlier, and the tanshin carries no year-on-year percentages against the consolidated figures at all — the change columns are simply blank. What the company offers instead, explicitly as reference information, is a comparison against its own parent-only (non-consolidated) first quarter of FY3/2026, when revenue was ¥429 million. On that basis revenue rose by roughly ¥410 million, or 95.2%. That is a real and large increase, but it is a consolidated group measured against an unconsolidated parent, and it should not be read as an organic like-for-like growth rate. No parent-only reference figures are given for the profit lines, so the profit columns in the table below carry an em dash rather than a comparison.
One more definition matters for reading the numbers. fonfun's adjusted operating profit (EBITDA) is operating profit plus goodwill amortization, plus amortization of customer-related assets, plus depreciation, plus software amortization, plus share-based compensation expense, plus acquisition-related costs. The ¥83 million gap between the ¥156 million adjusted figure and the ¥73 million reported operating profit is, in other words, largely the accounting cost of the acquisitions that produced the revenue growth in the first place — a point worth holding on to when comparing the two lines.
Sales Performer and the recurring-revenue base
The group classifies its operations into two segments, Cloud Solution and DX Solution. Cloud Solution comprises mainly SaaS-type services, and it is where the quarter's growth came from. During the three months the group expanded its recurring-revenue business while maintaining the stable earnings base of its existing SaaS operations — most notably by acquiring the "Sales Performer" SaaS business operated by Digloss Inc. on May 1, 2026. That acquisition is the principal reason revenue nearly doubled, and because it closed a month into the quarter it contributed only two of the three months; the full quarterly run rate has yet to appear in a reported period.
The strategic logic is straightforward. Subscription SaaS revenue is contracted and repeatable, so buying an established book of it converts cash into a durable revenue base rather than a one-off gain. fonfun has been explicit that it is actively expanding its organisational scale to strengthen a sustainable growth foundation and raise corporate value, while maintaining and expanding earnings from its existing businesses and using the know-how it accumulates to plan and offer new services.
DX Solution, and a market shifting from defence to offence
The second segment, DX Solution, promotes digital transformation for client companies and for society more broadly, producing businesses jointly with clients rather than selling packaged product. In the quarter it provided consulting centred on helping clients move off legacy systems and on building in-house DX capability, accumulating know-how in advanced technical problem-solving along the way. The group also reported steady progress hiring and developing digital talent across the organisation to underpin that growth — the binding constraint in this part of the Japanese market is people, not demand.
The market backdrop fonfun describes is one of structural transition rather than cyclical strength. Social implementation of advanced technology such as generative AI advanced rapidly, and the industry has entered a fundamental structural shift. In IT specifically, on top of the efficiency needs driven by a severe labour shortage, the wave of replacing legacy systems — Japan's so-called "2025 digital cliff" — has largely passed its peak. Market interest has moved noticeably as a result: from "defensive DX" aimed at cutting costs to "offensive DX" that monetises accumulated data. That shift calls for more complex, multi-domain problem-solving rather than the adoption of a single tool, which is precisely the kind of work a consulting-led practice can price well — and the company's read is that DX demand held at a high level rather than fading as a passing boom.
Balance sheet: growth funded without denting the equity base
Total assets stood at ¥3,481 million at June 30, 2026, up ¥196 million, or 6.0%, from ¥3,285 million at March 31. Net assets rose ¥66 million to ¥1,479 million from ¥1,413 million, and shareholders' equity rose by the same ¥66 million to ¥1,402 million from ¥1,336 million — an increase that corresponds exactly to the quarter's net profit, with no dividend paid out for the period. The equity ratio eased to 40.3% from 40.7%, a fall of 0.4 of a percentage point that reflects the balance sheet growing faster than retained earnings rather than any erosion of capital. For a company absorbing an acquisition, holding the equity ratio within half a point of where it started is a reasonable outcome.
No dividend was declared for the quarter. Investors should also note that a 1-for-3 share split took effect on January 30, 2026; per-share figures including the ¥3.15 EPS above are restated as if the split had occurred at the start of the prior fiscal year, so historical per-share comparisons taken from older releases will not line up unless similarly adjusted.
Guidance unchanged, and how the first quarter tracks against it
fonfun left its full-year forecast for FY3/2027 unchanged. It guides to revenue of ¥3,599 million, up 70.5%, adjusted operating profit (EBITDA) of ¥721 million, up 59.0%, operating profit of ¥472 million, up 95.1%, ordinary profit of ¥447 million, up 64.7%, and net profit attributable to owners of parent of ¥446 million, up 5.1%, for EPS of ¥21.26. The company manages on an annual basis and omits a first-half forecast entirely, so the full-year numbers are the only benchmark available.
Measured against them, the first quarter delivered 23.3% of the revenue target and 21.6% of the adjusted operating profit target — both comfortably ahead of a straight quarter-by-quarter pace on the top line and close to it on the adjusted measure. The reported profit lines are further behind: operating profit represents 15.5% of its full-year target, ordinary profit 13.4% and net profit 14.8%. That gap is not necessarily a warning. Sales Performer contributed only two months of the quarter, the acquisition-related costs that depress reported operating profit are front-loaded by nature, and the company's own headline measure strips them out. But it does mean the remaining three quarters have to carry roughly 85% of the reported operating profit target, and the burden of proof sits with the second half.
The narrower point of interest is the net profit line, where guidance calls for growth of just 5.1% against operating profit growth of 95.1% — a divergence that implies the prior year's bottom line was flattered by items below the operating line that do not repeat. Management will have the opportunity to address the shape of the year at an earnings briefing to be live-streamed on Monday, August 17, 2026.
| Metric | Q1 FY3/2027 (consolidated) | Q1 FY3/2026 (parent-only, reference) | Change |
|---|---|---|---|
| Revenue (¥ million) | 839 | 429 | +95.2% |
| Adjusted operating profit / EBITDA (¥ million) | 156 | — | — |
| Operating profit (¥ million) | 73 | — | — |
| Ordinary profit (¥ million) | 60 | — | — |
| Net profit attrib. to owners of parent (¥ million) | 66 | — | — |
| Basic EPS (¥) | 3.15 | — | — |
| Total assets (¥ million; vs Mar 31, 2026) | 3,481 | 3,285 | +6.0% |
| Net assets (¥ million; vs Mar 31, 2026) | 1,479 | 1,413 | +4.7% |
| Equity ratio (vs Mar 31, 2026) | 40.3% | 40.7% | −0.4 pt |
JapanStockPulse provides informational content only and does not constitute investment advice. Figures are taken from the company's published earnings short report and may be subject to subsequent revision.