The bottom line moved on a disposal, not on trading
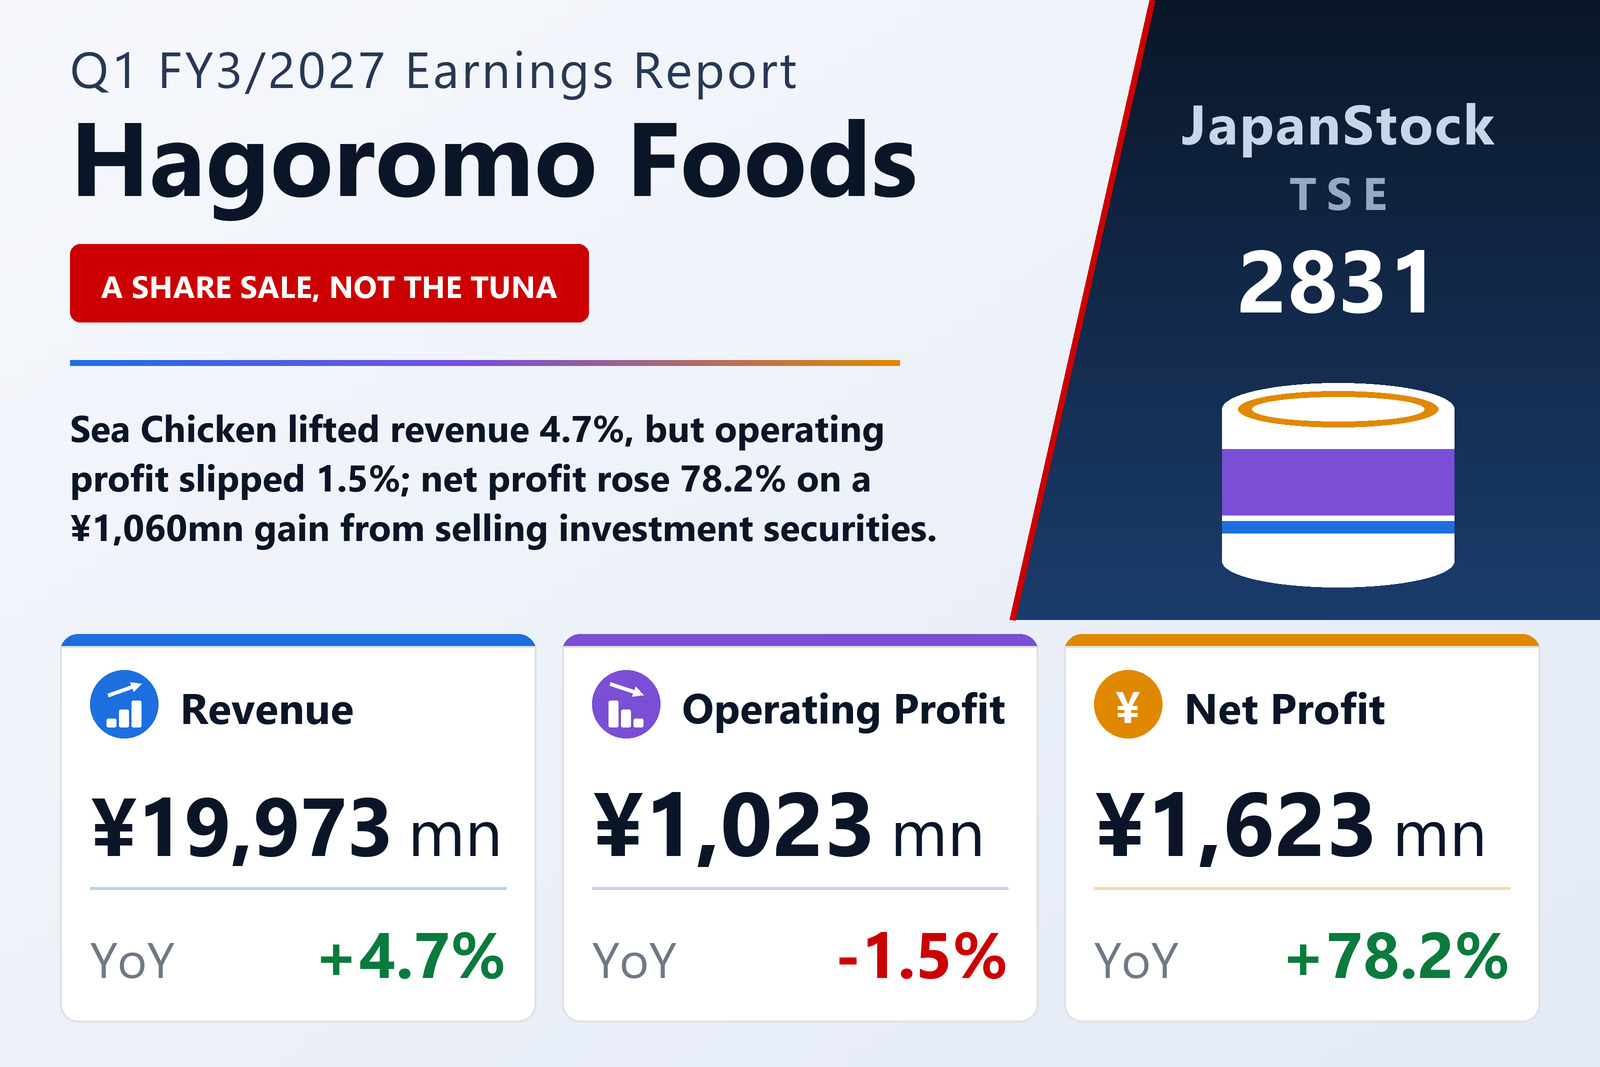
Hagoromo Foods Corporation (TSE: 2831), the Shizuoka-based maker of the "Sea Chicken" canned tuna brand and of desserts, pasta, prepared foods and pet food, published consolidated results for the three months to June 30, 2026 on August 13, 2026 under Japanese GAAP. Revenue rose 4.7% to ¥19,973 million, but operating profit fell 1.5% to ¥1,023 million and ordinary profit 2.0% to ¥1,292 million. Net profit attributable to owners of the parent nonetheless rose 78.2% to ¥1,623 million, for earnings per share of ¥172.53 against ¥96.82.
All of that increase, and more, sits below the ordinary line. Extraordinary income of ¥1,078 million — of which ¥1,059 million was a gain on the sale of investment securities, alongside ¥8 million from the sale of fixed assets and ¥10 million of compensation received — lifted pre-tax profit 79.8% to ¥2,370 million. The prior-year quarter recorded essentially no extraordinary income at all. This is a one-off disposal, not a change in earning power: the operating line is the one that describes the business, and it went backwards.
The same disposal explains what looks at first like a contradiction. Comprehensive income fell 70.4% to ¥404 million even as net profit rose 78.2%, because selling the shares moves the accumulated valuation gain out of other comprehensive income and through the income statement. Net unrealised gains on securities fell ¥1,278 million over the quarter and investment securities on the balance sheet fell ¥1,897 million to ¥20,977 million. The two effects very nearly cancel: retained earnings rose ¥1,294 million while the securities valuation reserve fell ¥1,278 million, so total net assets moved just ¥75 million, to ¥49,739 million, despite ¥1,623 million of reported profit.
Sea Chicken carried the top line; desserts and pasta did not
The group reports a single segment — food and related businesses — but discloses sales by product group, and the spread is wide. Tuna and related products, 47.9% of sales, rose 7.9% to ¥9,575 million: the mainstay oil-packed can "Sea Chicken Mild" ran well, and the salt-free "Shio Fushiyou Sea Chicken" and the easy-open, easy-clean pouch range "Sea Chicken Smile" both grew. Prepared foods rose 9.5% to ¥1,926 million. Against that, desserts fell 7.3% to ¥1,124 million — the "Asa kara Fruit" pouch range grew but the mainstay canned version and other fruit pouches were weak — and pasta and sauces fell 1.9% to ¥1,645 million, with macaroni running well but the bundled spaghetti "Popolo Spa" and canned pasta sauces both soft. Household foods as a whole rose 5.3% to ¥16,104 million, foodservice 2.0% to ¥3,220 million on convenience-store demand, and pet food and bio 4.6% to ¥568 million. Cases sold rose 3.7%, so roughly a point of the 4.7% revenue gain came from price and mix.
Why the operating line still fell is a matter of spending, not of gross margin. The cost-of-sales ratio improved 0.2 points to 78.2% and gross profit rose 5.9% to ¥4,358 million, but selling, general and administrative expenses rose 8.3% to ¥3,335 million. Advertising is the single largest driver, up 60.8%, or ¥186 million, behind a "Sea Chicken" collaboration with a popular character, consumer campaigns and a "Sea Chicken Shokudo" television commercial proposing recipes built on the company's mainstays. Packing, freight and warehousing added ¥35 million (+4.1%) and salaries and bonuses ¥16 million (+3.5%), against sales incentives down ¥25 million. Raw materials, packaging and logistics costs all rose, and the company put through price revisions on some products. Capital expenditure was ¥1,121 million (+39.7%) against depreciation of ¥329 million; no quarterly cash flow statement is prepared.
A balance sheet that barely moved, and a year still guided lower
Total assets rose ¥2,299 million to ¥82,692 million. Investment securities fell ¥1,897 million on the disposal, but trade receivables and contract assets rose ¥1,121 million, electronically recorded receivables ¥1,111 million, cash and deposits ¥930 million and inventories ¥595 million. Liabilities rose ¥2,224 million to ¥32,952 million — notes and accounts payable up ¥2,170 million and other current liabilities up ¥2,145 million, against accrued expenses down ¥1,763 million. Because both sides of the balance sheet grew while net assets stood still, the equity ratio slipped to 60.2% from 61.8%, still an unusually conservative capital structure. Net assets per share were ¥5,285.52 against ¥5,277.52.
Guidance is unchanged from the May 13, 2026 announcement, the company citing uncertainty over raw material and energy prices and the exchange rate. For the first half it expects revenue of ¥39,800 million (+2.3%), operating profit of ¥1,700 million (−22.9%), ordinary profit of ¥2,200 million (−14.3%) and net profit of ¥2,200 million (+20.8%), for earnings per share of ¥233.78. For the full year it expects revenue of ¥77,400 million (+3.1%), operating profit of ¥2,800 million (−11.0%), ordinary profit of ¥3,400 million (−8.4%) and net profit of ¥3,000 million (+13.8%), for earnings per share of ¥318.79. Note what the half-year figure implies: ¥1,700 million for the half, against ¥1,023 million already booked in the first quarter, leaves ¥677 million for the second — a third below this quarter. A quarter that lost 1.5% of operating profit therefore sits inside a year guided to lose 11.0% of it, and the filing does not explain the gap beyond confirming the forecast is unrevised. The annual dividend is guided at ¥70.00, level with FY3/2026 in total — but last year's ¥35.00 interim included a ¥5.00 commemorative payment, so the ordinary dividend in effect rises from ¥65.00 to ¥70.00.
| Metric | Q1 FY3/2027 | Q1 FY3/2026 | Change |
|---|---|---|---|
| Revenue (¥ million) | 19,973 | 19,076 | +4.7% |
| Gross profit (¥ million) | 4,358 | 4,117 | +5.9% |
| SG&A expenses (¥ million) | 3,335 | 3,078 | +8.3% |
| Operating profit (¥ million) | 1,023 | 1,038 | −1.5% |
| Ordinary profit (¥ million) | 1,292 | 1,319 | −2.0% |
| Gain on sale of investment securities (¥ million) | 1,059 | — | new |
| Pre-tax profit (¥ million) | 2,370 | 1,318 | +79.8% |
| Net profit attrib. to owners of parent (¥ million) | 1,623 | 911 | +78.2% |
| Comprehensive income (¥ million) | 404 | 1,365 | −70.4% |
| EPS (¥) | 172.53 | 96.82 | +78.2% |
| Tuna and related (¥ million) | 9,575 | 8,871 | +7.9% |
| Desserts (¥ million) | 1,124 | 1,213 | −7.3% |
| Pasta and sauces (¥ million) | 1,645 | 1,677 | −1.9% |
| Prepared foods (¥ million) | 1,926 | 1,758 | +9.5% |
| Dried bonito, nori and furikake (¥ million) | 965 | 956 | +1.0% |
| Gift and other foods (¥ million) | 867 | 811 | +6.9% |
| Household foods — subtotal (¥ million) | 16,104 | 15,288 | +5.3% |
| Foodservice (¥ million) | 3,220 | 3,157 | +2.0% |
| Pet food and bio (¥ million) | 568 | 543 | +4.6% |
| Other (¥ million) | 78 | 87 | −10.0% |
| Total assets (¥ million) | 82,692 | 80,393 | +2.9% |
| Net assets (¥ million) | 49,739 | 49,664 | +0.2% |
| Equity ratio | 60.2% | 61.8% | −1.6 pt |
| FY3/2027 guidance — revenue (¥ million) | 77,400 | — | +3.1% |
| FY3/2027 guidance — operating profit (¥ million) | 2,800 | — | −11.0% |
| FY3/2027 guidance — ordinary profit (¥ million) | 3,400 | — | −8.4% |
| FY3/2027 guidance — net profit (¥ million) | 3,000 | — | +13.8% |
| FY3/2027 guidance — EPS (¥) | 318.79 | — | n.m. |
| Annual dividend per share (¥) | 70.00 | 70.00 | unchanged |
JapanStockPulse provides informational content only and does not constitute investment advice. Figures are taken from the company's published earnings short report and may be subject to subsequent revision.