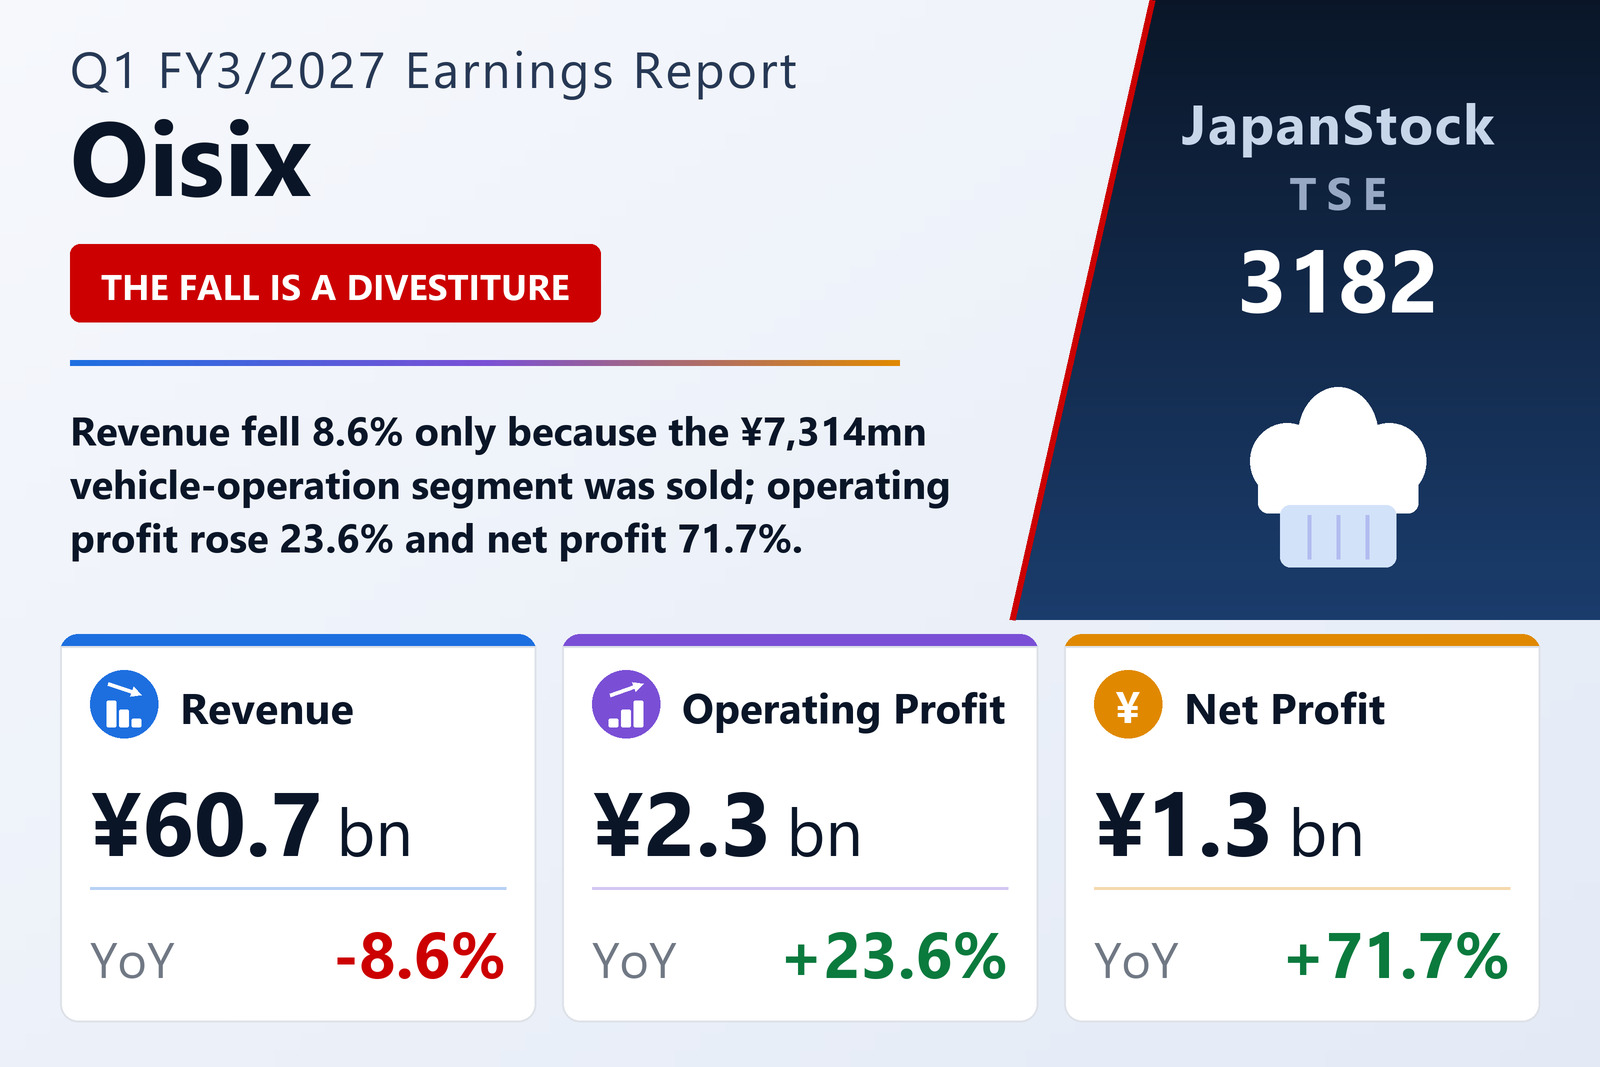
The 8.6% revenue fall is a business the company sold
Oisix Inc. (TSE: 3182), the Japanese food subscription group that runs the Oisix, Daichi wo Mamoru Kai, Radish Boya and Purple Carrot home-delivery brands alongside a contract-catering business and a social-services business, published consolidated results for the three months to June 30, 2026 on August 13, 2026 under Japanese GAAP. Revenue fell 8.6% to ¥60,682 million, but every profit line rose: EBITDA 0.5% to ¥3,374 million, operating profit 23.6% to ¥2,271 million, ordinary profit 34.9% to ¥2,226 million and net profit attributable to owners of the parent 71.7% to ¥1,289 million, for earnings per share of ¥37.11 against ¥21.62. Comprehensive income was ¥1,179 million, up 57.1%.
The revenue fall is not a shrinking business. In the previous fiscal year the company sold all its shares in Daishinto Co., Ltd. and one other subsidiary, and it has removed Vehicle Operation Services as a reporting segment. That segment produced ¥7,314 million of external revenue in the year-ago quarter and nothing this year; for comparability the company still prints the segment column in this period's disclosure, with no figures in it. Take the divested segment out of the prior-year base and revenue rose roughly 2.7%, from ¥59,109 million to ¥60,682 million, and the operating margin widened to 3.7% from 2.8%.
Catering overtakes home delivery
B2B Subscription, the contract-catering arm, is now the largest segment. Revenue rose 6.5% to ¥22,322 million — Life Care ¥8,894 million, contract catering ¥6,859 million, school meals ¥4,965 million — and segment profit rose from ¥18 million to ¥817 million, a more than fortyfold increase off a base close to zero. At ¥22,322 million against B2C's ¥21,999 million, catering outsells home delivery for the first time in the figures disclosed here. The company credits the October 2025 group reorganisation that made the catering business a wholly owned subsidiary, after which manufacturing, logistics, systems and corporate functions were integrated with the delivery business, lifting production-line utilisation. It sizes the domestic catering market at about ¥5 trillion and calls it stable but squeezed by labour shortages and rising input and personnel costs, and intends to grow through roll-up M&A alongside organic growth — most recently making Shidax Holdings' food business a wholly owned subsidiary and positioning it as the core of the segment — while transferring delivery-side product know-how, drawing on 250 million cumulative Kit Oisix meals sold, into higher-value items for elderly-care facilities such as its fully prepared Genki Gohan range.
B2C Subscription, the food home-delivery business, went the other way: revenue fell 7.1% to ¥21,999 million and segment profit slipped 1.5% to ¥1,771 million. All four brands declined — Oisix ¥14,072 million from ¥14,689 million, Daichi wo Mamoru Kai ¥2,347 million from ¥2,568 million, Radish Boya ¥3,961 million from ¥4,201 million, and Purple Carrot ¥1,618 million from ¥2,220 million, the steepest of the four. The company puts the domestic food home-delivery market at about ¥3 trillion growing roughly 3% a year, its own share in the low single digits and e-commerce at only about 4% of the total food market, and says it ranks first by gross merchandise value in the “speciality × subscription” niche on the strength of direct relationships with contract producers. Social Services grew fastest — revenue up 21.3% to ¥12,201 million on after-school childcare of ¥8,776 million from ¥6,877 million, and profit up 50.6% to ¥789 million. Other, which holds e-commerce support for third parties, mobile supermarkets and investment, fell 5.5% to ¥4,158 million with profit down to ¥55 million from ¥143 million.
Where the profit growth actually came from
Two lines deserve separating from the operating-profit headline. EBITDA — which the company defines as operating profit plus depreciation plus goodwill amortisation — rose only 0.5% against operating profit's 23.6%, because depreciation fell to ¥981 million from ¥1,173 million and goodwill amortisation to ¥121 million from ¥347 million. That combined ¥418 million covers almost all of the ¥434 million operating-profit increase. At the bottom of the statement, group net profit rose 28.8% to ¥1,168 million while net profit attributable to owners of the parent rose 71.7%; the gap is the non-controlling-interest line, which took ¥156 million of profit a year ago and absorbed a ¥120 million loss this year, a ¥276 million swing in the parent's favour. Below the operating line, interest expense fell to ¥131 million from ¥211 million, and there was no extraordinary income at all this year against ¥59 million last year.
Total assets rose ¥1,441 million to ¥109,578 million. Current assets rose ¥2,156 million to ¥55,391 million on ¥393 million more cash and deposits, ¥963 million more trade receivables and ¥1,028 million of other current assets, while fixed assets fell ¥715 million to ¥54,186 million. Liabilities rose only ¥690 million to ¥79,758 million, but the composition shifted: accounts payable up ¥857 million, accrued expenses up ¥825 million, contract liabilities up ¥1,181 million and deferred tax liabilities up ¥1,491 million, against short-term borrowings down ¥2,040 million, income taxes payable down ¥1,055 million and long-term borrowings down ¥790 million. Net assets rose ¥750 million to ¥29,820 million and the equity ratio improved to 25.8% from 25.3%. No cash flow statement is prepared for the first quarter.
Guidance was raised on August 3, 2026, above the figures published with the FY3/2026 results on May 14, and is unchanged since. The company expects FY3/2027 revenue of ¥252,000 million (+0.2%), EBITDA of ¥13,400 million (+3.8%), operating profit of ¥8,700 million (+18.5%) and net profit attributable to owners of the parent of ¥5,210 million (+15.1%), for earnings per share of ¥150.00. It is explicit about what changed: operating profit is tracking the original plan, and the upgrade to net profit and EPS came from a review of the tax effect of the B2B reorganisation — a tax outcome, not an operating one. The annual dividend was raised with it, to ¥30.00 from ¥20.00, but the shape changes: last year paid ¥8.00 interim and ¥12.00 final, while this year is guided at ¥0.00 interim and the whole ¥30.00 at the year end. Two more reorganisations follow the quarter. On July 1 two Shidax catering subsidiaries were merged and the survivor renamed Shidax Food Service Co., Ltd.; on July 23 the board resolved to absorb the wholly owned intermediate holding company ORD Food Service Holdings Co., Ltd. on September 1, waiving ¥19,060 million of loans to it on August 31 to clear its negative net worth. Because the counterparty is wholly owned, the waiver is eliminated on consolidation and has no effect on group results.
| Metric | Q1 FY3/2027 | Q1 FY3/2026 | Change |
|---|---|---|---|
| Revenue (¥ million) | 60,682 | 66,423 | −8.6% |
| EBITDA (¥ million) | 3,374 | 3,359 | +0.5% |
| Operating profit (¥ million) | 2,271 | 1,837 | +23.6% |
| Ordinary profit (¥ million) | 2,226 | 1,651 | +34.9% |
| Net profit (¥ million) | 1,168 | 907 | +28.8% |
| Net profit attrib. to owners of parent (¥ million) | 1,289 | 750 | +71.7% |
| Comprehensive income (¥ million) | 1,179 | 751 | +57.1% |
| EPS (¥) | 37.11 | 21.62 | +71.6% |
| B2C Subscription — revenue (¥ million) | 21,999 | 23,679 | −7.1% |
| B2C Subscription — segment profit (¥ million) | 1,771 | 1,798 | −1.5% |
| B2B Subscription — revenue (¥ million) | 22,322 | 20,968 | +6.5% |
| B2B Subscription — segment profit (¥ million) | 817 | 18 | +4,438.9% |
| Social Services — revenue (¥ million) | 12,201 | 10,061 | +21.3% |
| Social Services — segment profit (¥ million) | 789 | 524 | +50.6% |
| Vehicle Operation Services — revenue (¥ million) | — | 7,314 | n.m. |
| Vehicle Operation Services — segment profit (¥ million) | — | 582 | n.m. |
| Other — revenue (¥ million) | 4,158 | 4,398 | −5.5% |
| Other — segment profit (¥ million) | 55 | 143 | −61.5% |
| Total assets (¥ million) | 109,578 | 108,137 | +1.3% |
| Net assets (¥ million) | 29,820 | 29,069 | +2.6% |
| Shareholders' equity (¥ million) | 28,220 | 27,323 | +3.3% |
| Equity ratio | 25.8% | 25.3% | +0.5 pt |
| FY3/2027 guidance — revenue (¥ million) | 252,000 | — | +0.2% |
| FY3/2027 guidance — EBITDA (¥ million) | 13,400 | — | +3.8% |
| FY3/2027 guidance — operating profit (¥ million) | 8,700 | — | +18.5% |
| FY3/2027 guidance — net profit (¥ million) | 5,210 | — | +15.1% |
| FY3/2027 guidance — EPS (¥) | 150.00 | — | n.m. |
| Annual dividend per share (¥) | 30.00 | 20.00 | +50.0% |
JapanStockPulse provides informational content only and does not constitute investment advice. Figures are taken from the company's published earnings short report and may be subject to subsequent revision.