Traffic and average spend both rose against a weak consumer backdrop
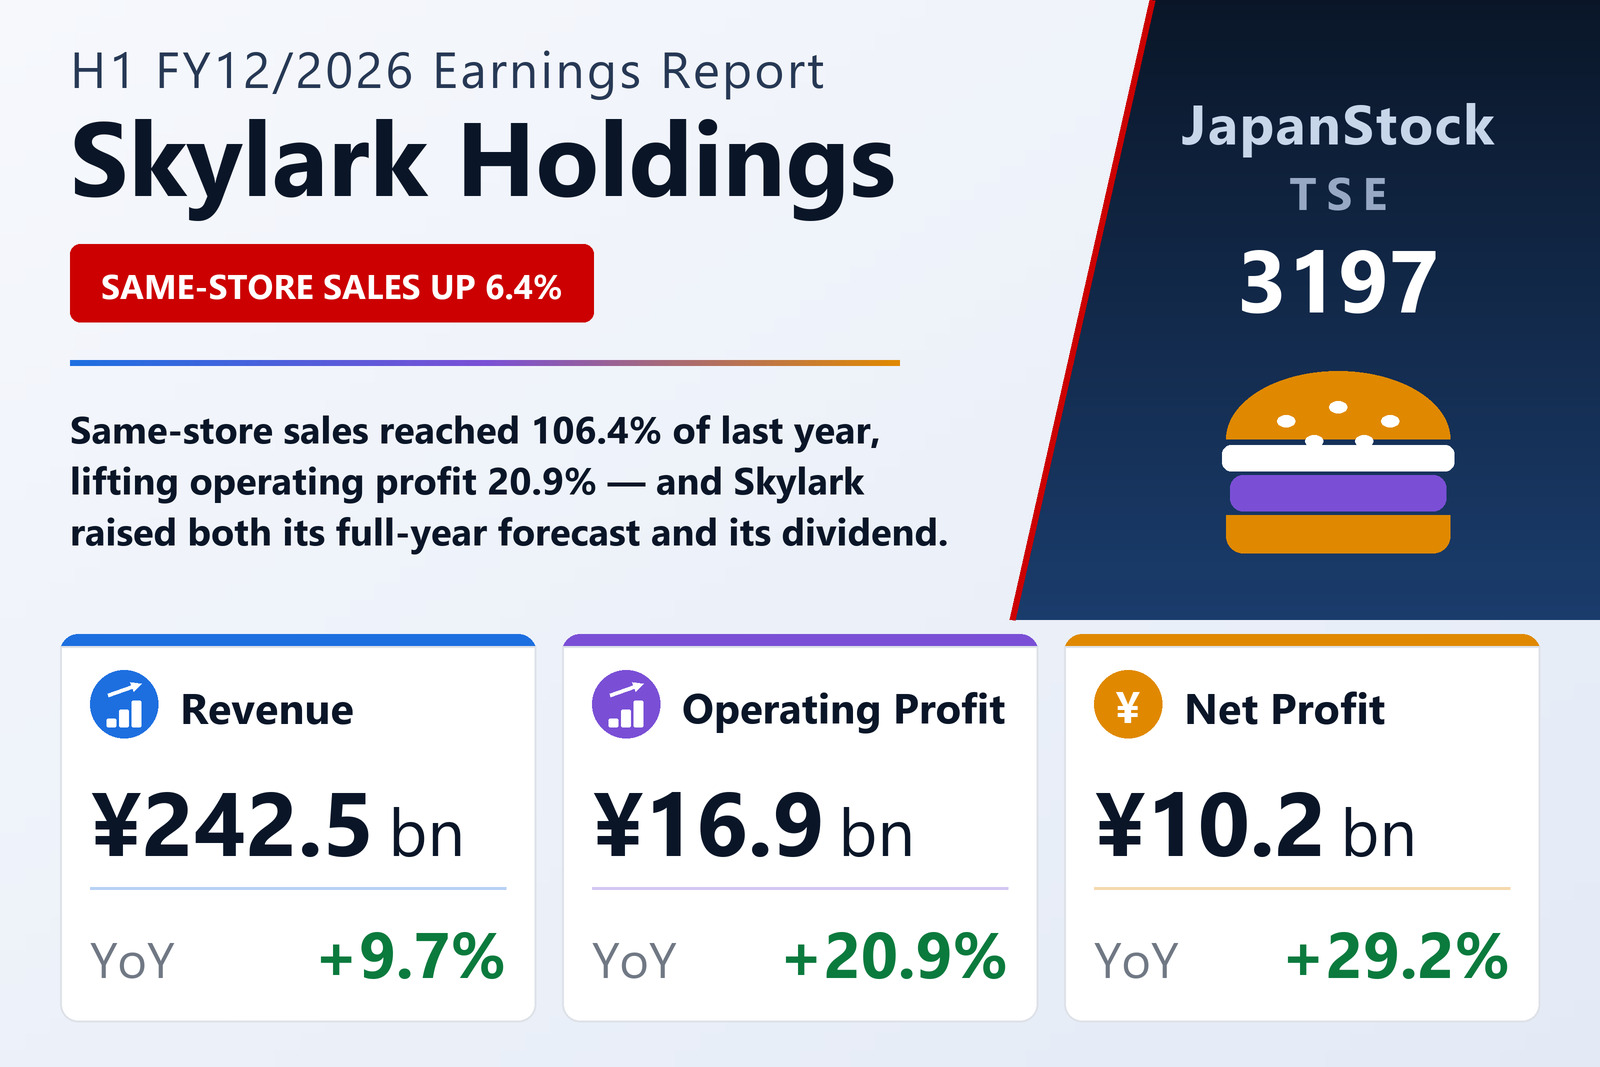
Skylark Holdings Co., Ltd. (TSE: 3197), Japan's largest family-restaurant group and the operator of Gusto, Shabu-yo, Jonathan's and Sukesan Udon, published consolidated results for the first half of FY12/2026 — the six months from January 1 to June 30, 2026 — on August 13, 2026 under IFRS. Revenue rose 9.7% to ¥242,457 million, business profit 13.4% to ¥16,959 million, operating profit 20.9% to ¥16,857 million, pre-tax profit 20.0% to ¥14,654 million and interim profit attributable to owners of the parent 29.2% to ¥10,181 million, for earnings per share of ¥44.77 against ¥34.64. EBITDA rose 12.1% to ¥43,699 million and adjusted EBITDA 10.4% to ¥44,768 million.
The Japanese economy the company describes is not an easy one: wage rises are expected to help, but geopolitical risk and high prices weighed on consumer sentiment. Against that, same-store sales ran at 106.4% of the prior year, with both customer counts and average spend rising. Management frames the year around two priorities. The first is an evolution of "store-centred management" — raising employees' cooking proficiency on the main grand menu to lift quality and productivity, and so free staff time for customers. The second is a menu and promotion strategy aimed at a consumer split in two: low-priced small plates to widen the choice for the value-seeking half, and collaborations with famous chefs and popular IP plus seasonal fair menus for the half that pays for the experience, amplified by television exposure and timely social-media posting.
Store count reaches 3,214 as Shinpachi joins the group
Skylark opened 21 new stores, led by Shabu-yo and Gusto, converted 26 existing sites to other formats, led by Sukesan Udon, remodelled 113 and closed 27. The largest single change was corporate: Shinpachi Co., Ltd. and its subsidiary Echigoya Co., Ltd. were brought into the consolidation during the half, adding 109 stores. Overseas growth investment also accelerated, with the first Sukesan Udon store in Taiwan and openings of Suki-ya (すき屋) in Malaysia. The group finished the period with 3,214 stores, a figure that includes 10 not yet open and held for conversion.
Costs moved against the group on one line and for it on another. Gross margin was 66.6%, down 0.2 points, as raw-material prices rose; the company says it contained part of the impact by cutting in-store food waste and through a cross-departmental cost-reduction project. SG&A rose ¥11,767 million to ¥144,413 million, mainly personnel costs from the new openings and conversions. Those are precisely the two lines business profit is made of — revenue less cost of sales less SG&A — and together they held its growth to 13.4%. Operating profit grew faster, at 20.9%, only because the items sitting between the two improved: other operating income rose to ¥1,174 million from ¥948 million while other operating expenses fell to ¥1,276 million from ¥1,956 million, and that was after a ¥272 million goodwill write-off on the 27 closures. Interim profit then grew faster still, 29.2%, because the tax charge of ¥4,473 million on ¥14,654 million of pre-tax profit is a lighter effective rate than last year's ¥4,335 million on ¥12,216 million. Business profit, EBITDA, adjusted EBITDA and adjusted profit are the company's own key indicators and are not measures defined by IFRS: business profit is revenue less cost of sales and SG&A, and operating profit is business profit adjusted for other operating income and expenses.
Assets built out for growth, and both guidance and dividend raised
Total assets rose ¥26,698 million to ¥545,247 million. Non-current assets did all the work, up ¥29,890 million to ¥480,861 million on property, plant and equipment, goodwill and other intangibles — the accounting shadow of the openings, conversions and the Shinpachi acquisition — while current assets fell ¥3,192 million to ¥64,386 million as cash and trade receivables declined. Liabilities rose ¥19,486 million to ¥350,468 million, almost all of it non-current bonds, borrowings and other financial liabilities. Total equity rose ¥7,212 million to ¥194,780 million: interim profit of ¥10,181 million less ¥3,185 million of dividends paid. Because assets grew faster than equity, the equity ratio slipped to 35.7% from 36.2%. The group reports no non-controlling interests, so equity attributable to owners of the parent is the whole of it.
Operating cash flow was ¥34,519 million, up ¥3,274 million, helped by the larger pre-tax profit and by a ¥1,830 million swing in other current liabilities, and held back by ¥2,263 million more income tax paid. Investing outflows widened by ¥7,109 million to ¥26,168 million on store investment in new sites, conversions and remodels, ¥1,407 million more spent on subsidiary shares and ¥1,268 million more placed in time deposits. Financing used ¥11,410 million, ¥4,059 million less than a year earlier, as both borrowing and repayment activity shrank sharply on both sides. Cash and cash equivalents ended the half at ¥31,357 million, ¥2,974 million lower than at December 31, 2025. After the period end, on July 30, 2026, the company issued its sixth unsecured bond — ¥20,000 million at 2.564%, maturing July 30, 2031 — for loan repayment and capital expenditure.
Both the forecast and the dividend were revised upward on results day, from the levels published with the FY12/2025 results on February 13, 2026. For the full year the company now guides revenue of ¥500,000 million (+9.2%), business profit of ¥37,000 million (+12.2%), operating profit of ¥35,000 million (+16.8%), pre-tax profit of ¥30,000 million (+14.2%) and profit attributable to owners of ¥20,500 million (+22.4%), for earnings per share of ¥90.14; adjusted full-year profit is guided at the same ¥20,500 million. The first half has already delivered 49.7% of that profit target. The annual dividend is raised to ¥27.00 from ¥22.00 — ¥10.00 interim, already fixed, and ¥17.00 final, against ¥8.00 and ¥14.00 a year earlier — a payout of just under 30% of guided earnings. The interim dividend, ¥2,274 million in total, is paid in part out of capital surplus. One comparability note: the prior-year interim figures reflect the finalisation, in the fourth quarter of FY12/2025, of the provisional accounting for a business combination.
| Metric | H1 FY12/2026 | H1 FY12/2025 | Change |
|---|---|---|---|
| Revenue (¥ million) | 242,457 | 220,975 | +9.7% |
| Gross profit (¥ million) | 161,372 | 147,599 | +9.3% |
| Gross margin | 66.6% | 66.8% | −0.2 pt |
| SG&A expenses (¥ million) | 144,413 | 132,646 | +8.9% |
| Business profit (¥ million) | 16,959 | 14,954 | +13.4% |
| Operating profit (¥ million) | 16,857 | 13,946 | +20.9% |
| Pre-tax profit (¥ million) | 14,654 | 12,216 | +20.0% |
| Net profit attrib. to owners of parent (¥ million) | 10,181 | 7,881 | +29.2% |
| Comprehensive income (¥ million) | 10,795 | 7,858 | +37.4% |
| EPS (¥) | 44.77 | 34.64 | +29.2% |
| EBITDA (¥ million) | 43,699 | 38,980 | +12.1% |
| Adjusted EBITDA (¥ million) | 44,768 | 40,564 | +10.4% |
| Net cash from operating activities (¥ million) | 34,519 | 31,245 | +10.5% |
| Same-store sales (prior year = 100) | 106.4 | — | n.m. |
| Stores at period end | 3,214 | — | n.m. |
| Total assets (¥ million) | 545,247 | 518,549 | +5.1% |
| Equity attrib. to owners of parent (¥ million) | 194,780 | 187,567 | +3.8% |
| Equity ratio | 35.7% | 36.2% | −0.5 pt |
| FY12/2026 guidance — revenue (¥ million) | 500,000 | — | +9.2% |
| FY12/2026 guidance — business profit (¥ million) | 37,000 | — | +12.2% |
| FY12/2026 guidance — operating profit (¥ million) | 35,000 | — | +16.8% |
| FY12/2026 guidance — pre-tax profit (¥ million) | 30,000 | — | +14.2% |
| FY12/2026 guidance — net profit (¥ million) | 20,500 | — | +22.4% |
| FY12/2026 guidance — EPS (¥) | 90.14 | — | n.m. |
| Annual dividend per share (¥) | 27.00 | 22.00 | +22.7% |
JapanStockPulse provides informational content only and does not constitute investment advice. Figures are taken from the company's published earnings short report and may be subject to subsequent revision.