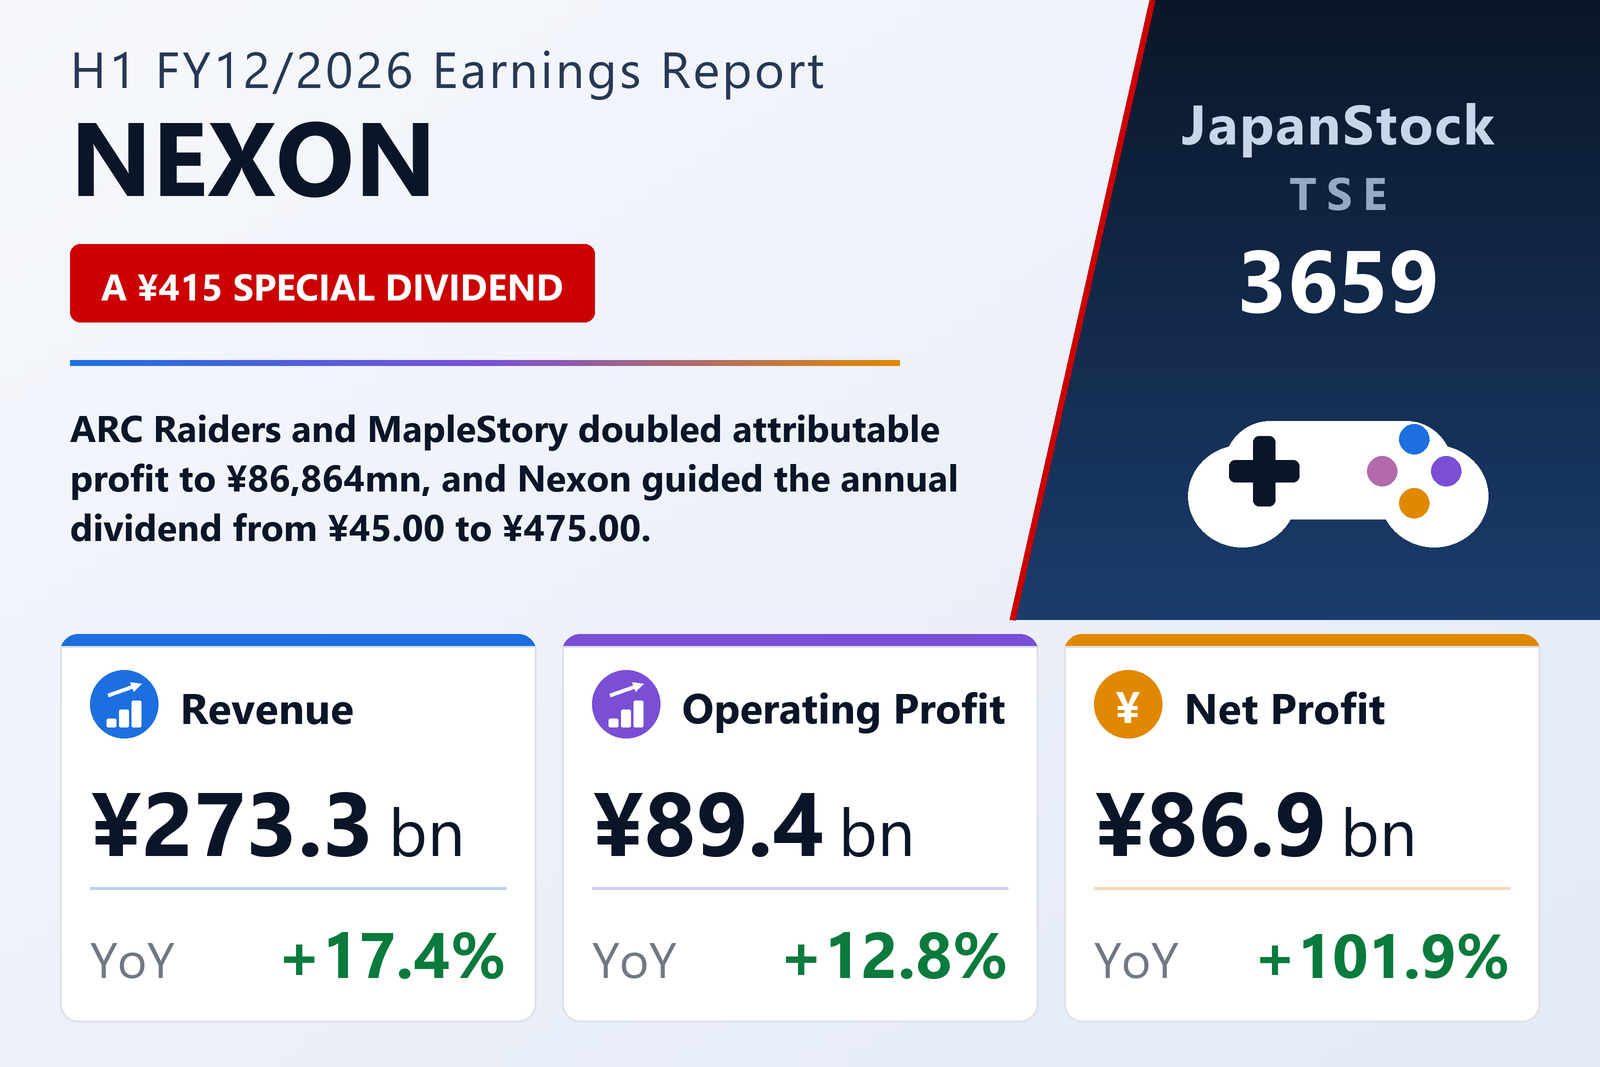
A payout more than ten times last year's
NEXON Co., Ltd. (TSE: 3659), the Tokyo-listed developer and operator of PC and mobile online games behind MapleStory, Dungeon&Fighter and ARC Raiders, published consolidated results for the six months to June 30, 2026 on August 13, 2026 under IFRS. Revenue rose 17.4% to ¥273,310 million, operating profit 12.8% to ¥89,447 million, pre-tax profit 71.4% to ¥115,798 million and profit attributable to owners of the parent 101.9% to ¥86,864 million, for basic earnings per share of ¥109.96 against ¥53.04. Comprehensive income moved the other way, down 26.6% to ¥63,608 million.
The number that dominates the release is the dividend. NEXON declared a third-quarter dividend of ¥415.00 per share, all of it a special dividend, on top of the ¥30.00 interim already declared and a ¥30.00 final, taking the guided annual payout to ¥475.00 against ¥45.00 paid for FY12/2025. The special payment alone is more than nine times the whole of last year's annual dividend and roughly 3.8 times the ¥109.96 the company earned per share in the half; the dividend forecast was revised in a separate release the same day, and payment is scheduled to begin on September 25, 2026. The buyback runs alongside it: NEXON spent ¥27,070 million on its own shares in the half, issued shares fell from 827,160,972 to 793,516,908, treasury shares from 35,753,527 to 9,173,910, and the board resolved on the same August 13 to cancel a further 13,238,900 shares — 1.7% of the total outstanding — on August 31, 2026.
One game put an entire region on the map
Europe is a reporting segment for the first time, broken out of "Other" because it had become too big to sit there, with prior-period figures restated on the new basis. Its revenue went from ¥2,837 million to ¥60,535 million, up 2,033.3%, and it swung from a ¥3,537 million loss to a ¥31,069 million segment profit. That is ARC Raiders, released globally in October 2025: roughly 800,000 further units sold in the second quarter took cumulative sales past 16.30 million. Europe now supplies 22.2% of group revenue and 34.0% of aggregate segment profit — from nothing a year ago. North America moved the same way on a smaller scale, revenue up 58.9% to ¥22,370 million and profit up 342.0% to ¥5,060 million.
The company's old centre of gravity shrank while that happened. Korea, still 68.3% of group revenue, saw revenue fall 12.0% to ¥186,564 million and segment profit fall 31.5% to ¥57,346 million; the segment includes royalty income from NEOPLE INC.'s Chinese licensing, NEOPLE being a subsidiary of NEXON Korea Corporation. The Dungeon&Fighter franchise fell across the board — the mobile version declined despite a May anniversary update and new monetisation, the Chinese PC version on a weak start to April's new-season update, and Korea against a high prior-year base with only a limited response to March's new-season update. FC, mainly EA SPORTS FC ONLINE, declined with no World Cup traffic effect and user-acquisition measures that did not deliver, and MABINOGI MOBILE fell against a high base. Pulling the other way, the MapleStory franchise set an all-time quarterly revenue record in the second quarter, with MapleStory Worlds up sharply on two user-created worlds launched in April and MapleStory: Idle RPG helped by an April half-anniversary update. Japan remains the anomaly: 0.9% of revenue at ¥2,324 million, down 13.3%, and a ¥1,738 million segment loss. China turned to a ¥183 million profit on revenue up 31.4% to ¥1,070 million, and Other narrowed its loss to ¥601 million.
Where the doubling actually came from, and what comes next
Operating profit rose 12.8% but pre-tax profit rose 71.4%, and the gap is foreign exchange, not operations. The prior period carried FX losses of ¥21,626 million inside finance costs; this period recorded FX gains of ¥12,797 million alongside ¥10,992 million of interest and dividend income, so net finance income and costs swung from −¥8,913 million to +¥27,921 million. A lower effective tax rate — 25.5% against 37.5% — carried the rest of the way to a doubled bottom line. Operations themselves were less flattering: the operating margin narrowed to 32.7% from 34.1% as cost of sales rose on higher headcount-driven personnel cost, software- and cloud-service costs and MapleStory Worlds creator payouts, while SG&A rose on performance marketing for MapleStory: Idle RPG and on platform fees for that title and ARC Raiders, partly offset by lower share-based compensation. Comprehensive income falling 26.6% while profit doubled is the same story seen from the other side.
The balance sheet shrank and strengthened at once. Total assets fell ¥53,793 million to ¥1,356,395 million, mainly on other deposits (−¥46,368 million) and other financial assets (−¥39,182 million), partly offset by cash and equivalents up ¥47,234 million to ¥546,102 million. Total liabilities fell ¥73,343 million to ¥270,927 million on deferred tax liabilities (−¥22,324 million), other current liabilities (−¥19,346 million), deferred revenue (−¥14,429 million) and income taxes payable (−¥11,330 million), against other financial liabilities up ¥17,967 million. Total equity rose ¥19,550 million to ¥1,085,468 million as ¥86,864 million of retained earnings was offset by a ¥49,031 million fall in other components of equity from financial assets measured at fair value through other comprehensive income, and the equity ratio improved to 79.4% from 75.0%. Operating cash flow was ¥37,512 million against ¥88,059 million a year earlier, after ¥49,712 million of income tax paid.
Guidance is the part to read carefully. NEXON says a reasonable full-year estimate is not currently possible — PC and mobile game markets are too dependent on user tastes and hit titles — so it discloses only a nine-month cumulative forecast, and as a range: revenue of ¥394,042–406,746 million (+12.1% to +15.7%), operating profit of ¥112,052–121,716 million (−4.1% to +4.2%), pre-tax profit of ¥141,483–151,148 million (+16.0% to +23.9%), nine-month profit of ¥103,728–111,145 million (+29.8% to +39.1%), profit attributable to owners of ¥105,088–112,505 million (+29.4% to +38.6%) and earnings per share of ¥133.58–143.00. Subtract the half just reported and the implied standalone third quarter is guided down hard: operating profit of ¥22,605–32,269 million (−39.8% to −14.0%) and attributable profit of ¥18,223–25,640 million (−52.3% to −32.8%). ARC Raiders is a buy-to-play title whose sales concentrate at launch, and the company expects it to normalise while still adding revenue. The forecast assumes US$1 = ¥162.60, 100 won = ¥10.89 and CNY1 = ¥23.94, with a ¥1 move in the dollar rate worth about ¥778 million of quarterly revenue and ¥191 million of operating profit.
| Metric | H1 FY12/2026 | H1 FY12/2025 | Change |
|---|---|---|---|
| Revenue (¥ million) | 273,310 | 232,784 | +17.4% |
| Operating profit (¥ million) | 89,447 | 79,309 | +12.8% |
| Operating margin | 32.7% | 34.1% | −1.3 pt |
| Pre-tax profit (¥ million) | 115,798 | 67,545 | +71.4% |
| Net profit attrib. to owners of parent (¥ million) | 86,864 | 43,030 | +101.9% |
| Comprehensive income (¥ million) | 63,608 | 86,687 | −26.6% |
| EPS (¥) | 109.96 | 53.04 | +107.3% |
| Japan — revenue (¥ million) | 2,324 | 2,679 | −13.3% |
| Japan — segment profit (¥ million) | −1,738 | −1,844 | loss narrowed |
| Korea — revenue (¥ million) | 186,564 | 212,085 | −12.0% |
| Korea — segment profit (¥ million) | 57,346 | 83,746 | −31.5% |
| China — revenue (¥ million) | 1,070 | 815 | +31.4% |
| China — segment profit (¥ million) | 183 | −112 | loss to profit |
| North America — revenue (¥ million) | 22,370 | 14,078 | +58.9% |
| North America — segment profit (¥ million) | 5,060 | 1,144 | +342.0% |
| Europe — revenue (¥ million) | 60,535 | 2,837 | +2,033.3% |
| Europe — segment profit (¥ million) | 31,069 | −3,537 | loss to profit |
| Other — revenue (¥ million) | 447 | 290 | +54.6% |
| Other — segment profit (¥ million) | −601 | −1,419 | loss narrowed |
| Total assets (¥ million) | 1,356,395 | 1,410,188 | −3.8% |
| Equity attrib. to owners of parent (¥ million) | 1,076,812 | 1,057,544 | +1.8% |
| Equity ratio | 79.4% | 75.0% | +4.4 pt |
| 9M FY12/2026 guidance, low end — revenue (¥ million) | 394,042 | — | +12.1% |
| 9M FY12/2026 guidance, low end — operating profit (¥ million) | 112,052 | — | −4.1% |
| 9M FY12/2026 guidance, low end — pre-tax profit (¥ million) | 141,483 | — | +16.0% |
| 9M FY12/2026 guidance, low end — profit attrib. to owners of parent (¥ million) | 105,088 | — | +29.4% |
| 9M FY12/2026 guidance, low end — EPS (¥) | 133.58 | — | n.m. |
| FY12/2026 third-quarter special dividend per share (¥) | 415.00 | — | new |
| Annual dividend per share (¥) | 475.00 | 45.00 | +955.6% |
JapanStockPulse provides informational content only and does not constitute investment advice. Figures are taken from the company's published earnings short report and may be subject to subsequent revision.