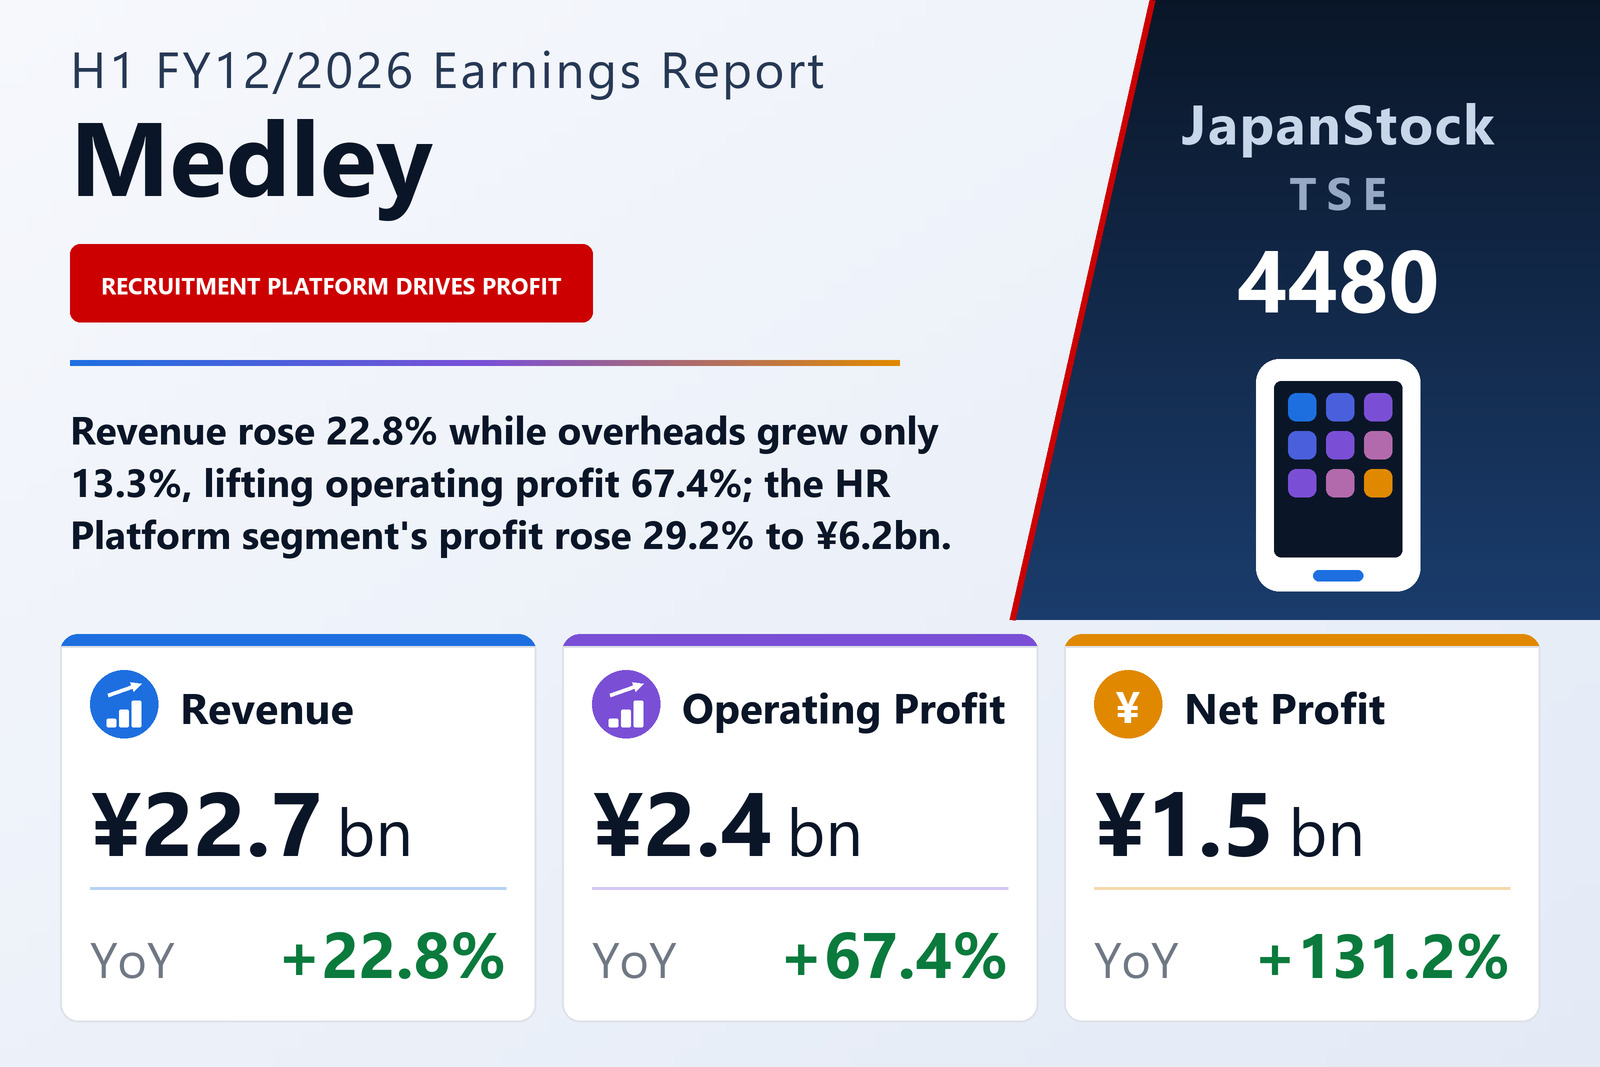
Revenue grew 22.8%, overheads 13.3% — that spread is the half
Medley, Inc. (TSE: 4480), which runs a recruitment platform for medical and nursing-care workplaces alongside cloud software for medical institutions, published consolidated first-half results for the six months from January 1 to June 30, 2026 on August 13, 2026 under Japanese GAAP. Revenue rose 22.8% to ¥22,683 million, operating profit 67.4% to ¥2,446 million, ordinary profit 77.6% to ¥2,802 million and profit attributable to owners of the parent 131.2% to ¥1,497 million, for earnings of ¥49.45 per share against ¥20.05. The filing lists the Tokyo Stock Exchange as the company's listing venue.
The improvement did not come from the gross line. Cost of sales rose 27.2% to ¥8,863 million, faster than revenue, so gross profit grew a slower 20.2% to ¥13,819 million and the gross margin slipped from 62.3% to 60.9%. It came instead from overheads: selling, general and administrative expenses rose 13.3% to ¥11,373 million, well short of revenue growth, which lifted the operating margin from 7.9% to 10.8% even as the company says it kept spending on marketing, its online training system, organisational build-out in the medical business and new AI functions. Medley also reports EBITDA, which it defines as operating profit plus depreciation, goodwill amortisation and share-based compensation expense; on that measure the half produced ¥3,866 million, up 43.4%, a margin of 17.0% against 14.6%. The cash-flow statement shows the two largest add-backs: depreciation of ¥551 million and goodwill amortisation of ¥710 million.
Settlement income and a lighter tax charge carried profit further
Ordinary profit grew faster than operating profit, 77.6% to ¥2,802 million, because non-operating income rose to ¥525 million from ¥311 million. Most of it was settlement money received of ¥432 million, against ¥270 million a year earlier; the filing does not describe the underlying settlement. Non-operating expenses fell to ¥168 million, including interest of ¥106 million. Below that line the comparison runs the other way: last year's half carried extraordinary gains of ¥204 million, chiefly a ¥155 million gain on selling shares in an affiliate and a ¥48 million gain on a business transfer, while this half recorded almost none and booked ¥50 million of extraordinary losses, including ¥47 million on a step acquisition. Pre-tax profit was ¥2,752 million, up 54.7%.
The largest single swing between pre-tax and net profit is tax. Income taxes rose only 11.0% to ¥1,255 million, which is 45.6% of pre-tax profit against 63.6% a year earlier; the filing notes that interim tax is calculated by applying an estimated full-year effective rate, but it gives no reason for the lower ratio. Net profit therefore more than doubled, to ¥1,497 million. Earnings per share rose further still, by 146.6%, because the average share count fell to 30,282,197 from 32,307,903 after share buybacks.
HR Platform earns the profit; Medical Platform's loss widened by choice
The HR Platform segment, built around the company's recruitment system for medical and nursing-care workplaces, grew revenue 24.4% to ¥16,682 million and segment profit before corporate cost allocation 29.2% to ¥6,217 million. The filing says customer workplaces and registered worker members both kept rising: customer workplaces across the segment reached 466,000, up 3.8% from the prior year-end, job postings reached 477,000, up 1.3%, and applications continued to increase. Customer workplaces for its online training system also grew. The company adds a seasonal caveat: it books this segment's revenue on the date a job seeker starts work, so hires and revenue tend to cluster in April, the conventional start of the Japanese working year — which falls inside this half.
The Medical Platform segment grew revenue 22.8% to ¥5,488 million as more institutions adopted its products, taking the count of medical institutions using the platform to about 23,000, up 2.1% from the prior year-end, and the company expanded AI functions in its MEDLEY AI CLOUD offering. Its segment loss widened to ¥484 million from ¥51 million; the filing attributes the loss to prioritising initiatives aimed at high revenue growth. New Services in Development shrank 12.9% to ¥513 million, which the filing puts down to the sale of a healthcare business, and its loss widened to ¥385 million from ¥349 million on investment to expand and build operations for its recruitment business in the United States. The three segments together earned ¥5,348 million before intersegment eliminations and unallocated corporate costs of ¥2,902 million, down 1.6%.
More borrowing, more buybacks and a thinner equity ratio
Total assets rose 10.0% to ¥45,384 million from ¥41,252 million at December 31, 2025, led by cash and deposits, which grew by ¥3,467 million to ¥12,042 million. Goodwill declined to ¥12,494 million from ¥12,861 million as amortisation ran on. Liabilities rose ¥3,970 million to ¥30,423 million: long-term borrowings grew to ¥14,049 million and the current portion to ¥4,782 million, and accrued income taxes rose to ¥1,428 million. Net assets edged up only 1.1% to ¥14,961 million, because the ¥1,497 million added to retained earnings was largely absorbed by a ¥1,249 million increase in treasury stock, so the equity ratio fell from 35.9% to 33.0%.
Operating cash flow was ¥3,326 million against ¥1,929 million, helped by income taxes paid of only ¥128 million against ¥1,020 million and held back by a ¥722 million rise in other receivables. Investing outflows shrank to ¥762 million from ¥6,330 million, a year ago having included ¥6,513 million spent acquiring subsidiaries. Financing brought in a net ¥898 million: ¥5,000 million of new long-term borrowing, against ¥2,373 million of repayments and ¥1,709 million spent buying back 862,200 shares.
Guidance unchanged, a ¥18 dividend and an acquisition after the period
Medley left unchanged the full-year FY12/2026 forecast it published on February 13, 2026: revenue of ¥46,400 million (+26.1%), EBITDA of ¥5,800 million (+20.3%), operating profit of ¥2,950 million (+37.2%), ordinary profit of ¥3,250 million (+47.6%) and net profit attributable to owners of ¥1,800 million (+84.5%), for earnings per share of ¥58.25. The first half has already delivered 48.9% of guided revenue but 82.9% of guided operating profit and 83.2% of guided net profit, which leaves an implied second-half operating profit of only about ¥504 million against the ¥2,446 million just booked. With revenue close to evenly split, that implies much heavier second-half costs, which the filing does not itemise.
On the dividend, Medley paid nothing for FY12/2025 and now forecasts a year-end payment of ¥18.00 per share for FY12/2026, with no interim dividend; the filing flags this as a revision to its most recently published dividend forecast. That would be about 31% of the guided ¥58.25 of earnings per share. After the period, on August 3, 2026, the company completed a ¥1,000 million cash acquisition of 100% of a newly established company that took over, by absorption-type split, the entire business of a provider of job-change and recruitment-support services for doctors and pharmacists; the goodwill, acquisition costs and assets acquired are not yet determined. On August 13, 2026 the board also resolved to cancel 930,000 treasury shares on August 31, 2026. At June 30 the company held 2,517,716 treasury shares out of 32,738,600 issued.
| Metric | H1 FY12/2026 | H1 FY12/2025 | Change |
|---|---|---|---|
| Revenue (¥ million) | 22,683 | 18,465 | +22.8% |
| Gross profit (¥ million) | 13,819 | 11,496 | +20.2% |
| Gross margin | 60.9% | 62.3% | −1.4 pt |
| SG&A expenses (¥ million) | 11,373 | 10,034 | +13.3% |
| EBITDA (¥ million) | 3,866 | 2,696 | +43.4% |
| Operating profit (¥ million) | 2,446 | 1,461 | +67.4% |
| Operating margin | 10.8% | 7.9% | +2.9 pt |
| Ordinary profit (¥ million) | 2,802 | 1,577 | +77.6% |
| Net profit attrib. to owners of parent (¥ million) | 1,497 | 647 | +131.2% |
| EPS (¥) | 49.45 | 20.05 | +146.6% |
| HR Platform — revenue (¥ million) | 16,682 | 13,409 | +24.4% |
| HR Platform — segment profit (¥ million) | 6,217 | 4,810 | +29.2% |
| Medical Platform — revenue (¥ million) | 5,488 | 4,468 | +22.8% |
| Medical Platform — segment profit (¥ million) | −484 | −51 | loss widened |
| New Services in Development — revenue (¥ million) | 513 | 589 | −12.9% |
| New Services in Development — segment profit (¥ million) | −385 | −349 | loss widened |
| Total assets (¥ million) | 45,384 | 41,252 | +10.0% |
| Net assets (¥ million) | 14,961 | 14,799 | +1.1% |
| Equity ratio | 33.0% | 35.9% | −2.9 pt |
| FY12/2026 guidance — revenue (¥ million) | 46,400 | — | +26.1% |
| FY12/2026 guidance — EBITDA (¥ million) | 5,800 | — | +20.3% |
| FY12/2026 guidance — operating profit (¥ million) | 2,950 | — | +37.2% |
| FY12/2026 guidance — ordinary profit (¥ million) | 3,250 | — | +47.6% |
| FY12/2026 guidance — net profit (¥ million) | 1,800 | — | +84.5% |
| FY12/2026 guidance — EPS (¥) | 58.25 | — | — |
| Annual dividend per share (¥) | 18.00 | 0.00 | new |
JapanStockPulse provides informational content only and does not constitute investment advice. Figures are taken from the company's published earnings short report and may be subject to subsequent revision.