Cloud subscriptions now carry 92% of revenue
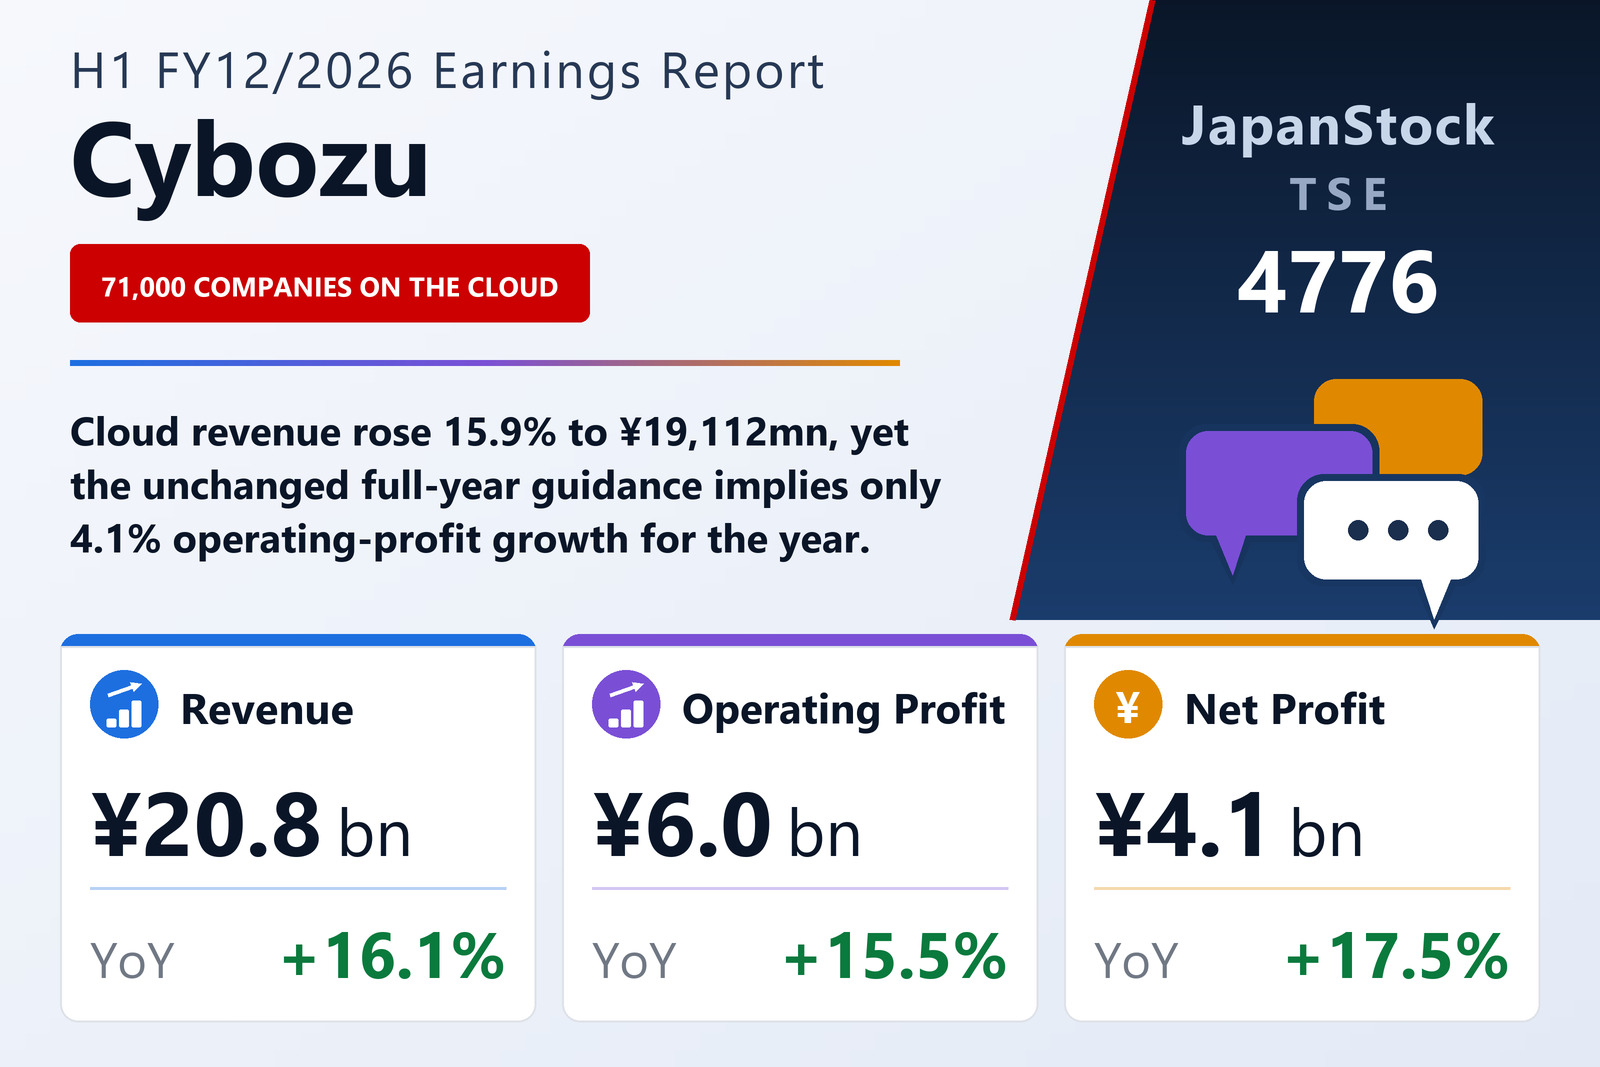
Cybozu, Inc. (TSE: 4776), the Tokyo-based developer of cloud groupware and business-application software, published consolidated results for the six months to June 30, 2026 on August 13, 2026 under Japanese GAAP. Revenue rose 16.1% to ¥20,780 million, operating profit 15.5% to ¥5,963 million, ordinary profit 21.1% to ¥6,065 million and interim net profit attributable to owners of the parent 17.5% to ¥4,067 million, for earnings per share of ¥88.16 against ¥74.91. Comprehensive income was the one headline line that fell, down 4.8% to ¥3,757 million, because a ¥461 million valuation loss on other securities replaced the prior year's ¥556 million gain.
The engine is the cloud service the company launched in November 2011. Contracted companies have passed 71,000 and contracted user licences 3.80 million, and cloud-related revenue reached ¥19,112 million, up 15.9% — about 92% of group revenue. The revenue-recognition note makes the same point from another angle: ¥20,342 million of the ¥20,780 million total, or 97.9%, was recognised over time rather than at a point in time, which is what a subscription book looks like. Contract liabilities — amounts billed but not yet earned — rose to ¥5,996 million from ¥5,424 million.
Four cost lines held profit growth just below revenue growth
Gross profit rose 16.2% to ¥18,895 million, marginally ahead of revenue, but selling, general and administrative expenses rose 16.5% to ¥12,932 million, and that is where the 0.6-point gap between revenue growth and operating-profit growth comes from. The company names four causes. Cost of sales rose 15.0% to ¥1,884 million, including the running costs of the professional basketball team Ehime Orange Vikings, which the group operates. Personnel expense rose 8.6% to ¥5,367 million on higher headcount and pay rises. Advertising expense rose 26.4% to ¥3,242 million as the company continued to invest aggressively. And research and development expense rose 27.0% to ¥894 million as it stepped up long-term R&D aimed at creating new businesses with a global horizon. The operating margin therefore slipped to 28.7% from 28.8% — a decline small enough to read as a company holding a very high margin while spending harder, rather than as margin erosion.
Below the operating line the direction reverses. Ordinary profit grew 21.1%, well ahead of operating profit's 15.5%, on foreign-exchange gains from forward exchange contracts: the company booked an ¥83 million FX gain this half where the prior year carried a ¥173 million FX loss, a ¥256 million swing that lands directly on the ordinary line. Extraordinary losses of ¥130 million then took a little back, of which ¥100 million was a goodwill write-off attached to Ehime Sports Entertainment Co., Ltd., the basketball operator. The parent wrote down its holding to reflect a fall in the excess earning power assumed at acquisition, and the group amortised the matching goodwill in full, taking the balance-sheet goodwill line from ¥106 million to zero.
Unchanged guidance implies a materially weaker second half
Full-year guidance is unchanged from the forecast published on December 18, 2025: revenue of ¥42,168 million (+12.7%), operating profit of ¥10,514 million (+4.1%), ordinary profit of ¥10,732 million (+3.9%), net profit of ¥7,445 million (+5.1%) and earnings per share of ¥163.26. Set against a first half that grew operating profit 15.5%, that leaves specific arithmetic. Subtracting the reported first half from the full-year targets, the implied second half is revenue of ¥21,388 million, operating profit of ¥4,551 million, ordinary profit of ¥4,667 million and net profit of ¥3,378 million. Operating profit of ¥4,551 million would be 23.7% below the ¥5,963 million just reported, and net profit of ¥3,378 million would be 16.9% below the ¥4,067 million just reported — on revenue implied to be 2.9% higher. The first half has already delivered 56.7% of the full-year operating-profit target on 49.3% of the revenue. The filing offers no explanation for the gap beyond confirming that the forecast is unrevised, and none should be read into it that the company has not given.
The balance sheet shrank. Total assets fell 2.3% to ¥29,433 million as cash and deposits dropped ¥3,024 million to ¥8,670 million and listed equity holdings fell in value, partly offset by bond purchases that lifted investment securities to ¥3,027 million. Liabilities fell ¥488 million to ¥11,836 million: contract liabilities rose, but income taxes payable fell ¥804 million on payment. Net assets fell ¥217 million to ¥17,597 million even though the company earned ¥4,067 million, and the reasons are almost entirely returns of capital. Retained earnings rose ¥2,218 million — the profit less a ¥1,849 million dividend payment, Cybozu paying once a year at the year end — while a ¥2,237 million buyback of 933,900 shares under a May 14, 2026 board resolution took treasury stock from ¥4,251 million to ¥6,454 million. A ¥383 million fall in accumulated other comprehensive income did the rest. The equity ratio still improved to 59.5% from 59.1%, because the asset base shrank faster than equity did.
A subsequent-events note completes the buyback. The May 14 resolution authorised up to 3,000,000 shares — 6.5% of shares outstanding excluding treasury — for up to ¥3.0 billion between May 15 and July 31, 2026. Between July 1 and July 24 the company bought a further 304,100 shares for ¥762 million, and the programme was closed on July 24. Together with the ¥2,237 million spent in the first half that is ¥2,999 million on 1,238,000 shares: effectively the whole yen ceiling, and far short of the share ceiling, because the value cap bound first. The annual dividend is guided at ¥50.00 against ¥40.00 for the prior year, again payable entirely as a year-end dividend, and is unchanged from the previous forecast.
| Metric | H1 FY12/2026 | H1 FY12/2025 | Change |
|---|---|---|---|
| Revenue (¥ million) | 20,780 | 17,899 | +16.1% |
| Cloud-related revenue (¥ million) | 19,112 | — | +15.9% |
| Gross profit (¥ million) | 18,895 | 16,259 | +16.2% |
| SG&A expenses (¥ million) | 12,932 | 11,096 | +16.5% |
| Personnel expense (¥ million) | 5,367 | 4,940 | +8.6% |
| Advertising expense (¥ million) | 3,242 | 2,565 | +26.4% |
| R&D expense (¥ million) | 894 | 704 | +27.0% |
| Operating profit (¥ million) | 5,963 | 5,163 | +15.5% |
| Operating margin | 28.7% | 28.8% | −0.1 pt |
| Ordinary profit (¥ million) | 6,065 | 5,006 | +21.1% |
| Net profit (¥ million) | 4,067 | 3,462 | +17.5% |
| Comprehensive income (¥ million) | 3,757 | 3,948 | −4.8% |
| EPS (¥) | 88.16 | 74.91 | +17.7% |
| Cash and deposits (¥ million) | 8,670 | 11,694 | −25.9% |
| Contract liabilities (¥ million) | 5,996 | 5,424 | +10.5% |
| Total assets (¥ million) | 29,433 | 30,140 | −2.3% |
| Net assets (¥ million) | 17,597 | 17,815 | −1.2% |
| Shareholders' equity (¥ million) | 17,518 | 17,810 | −1.6% |
| Equity ratio | 59.5% | 59.1% | +0.4 pt |
| FY12/2026 guidance — revenue (¥ million) | 42,168 | — | +12.7% |
| FY12/2026 guidance — operating profit (¥ million) | 10,514 | — | +4.1% |
| FY12/2026 guidance — ordinary profit (¥ million) | 10,732 | — | +3.9% |
| FY12/2026 guidance — net profit (¥ million) | 7,445 | — | +5.1% |
| FY12/2026 guidance — EPS (¥) | 163.26 | — | n.m. |
| Annual dividend per share (¥) | 50.00 | 40.00 | +25.0% |
JapanStockPulse provides informational content only and does not constitute investment advice. Figures are taken from the company's published earnings short report and may be subject to subsequent revision.