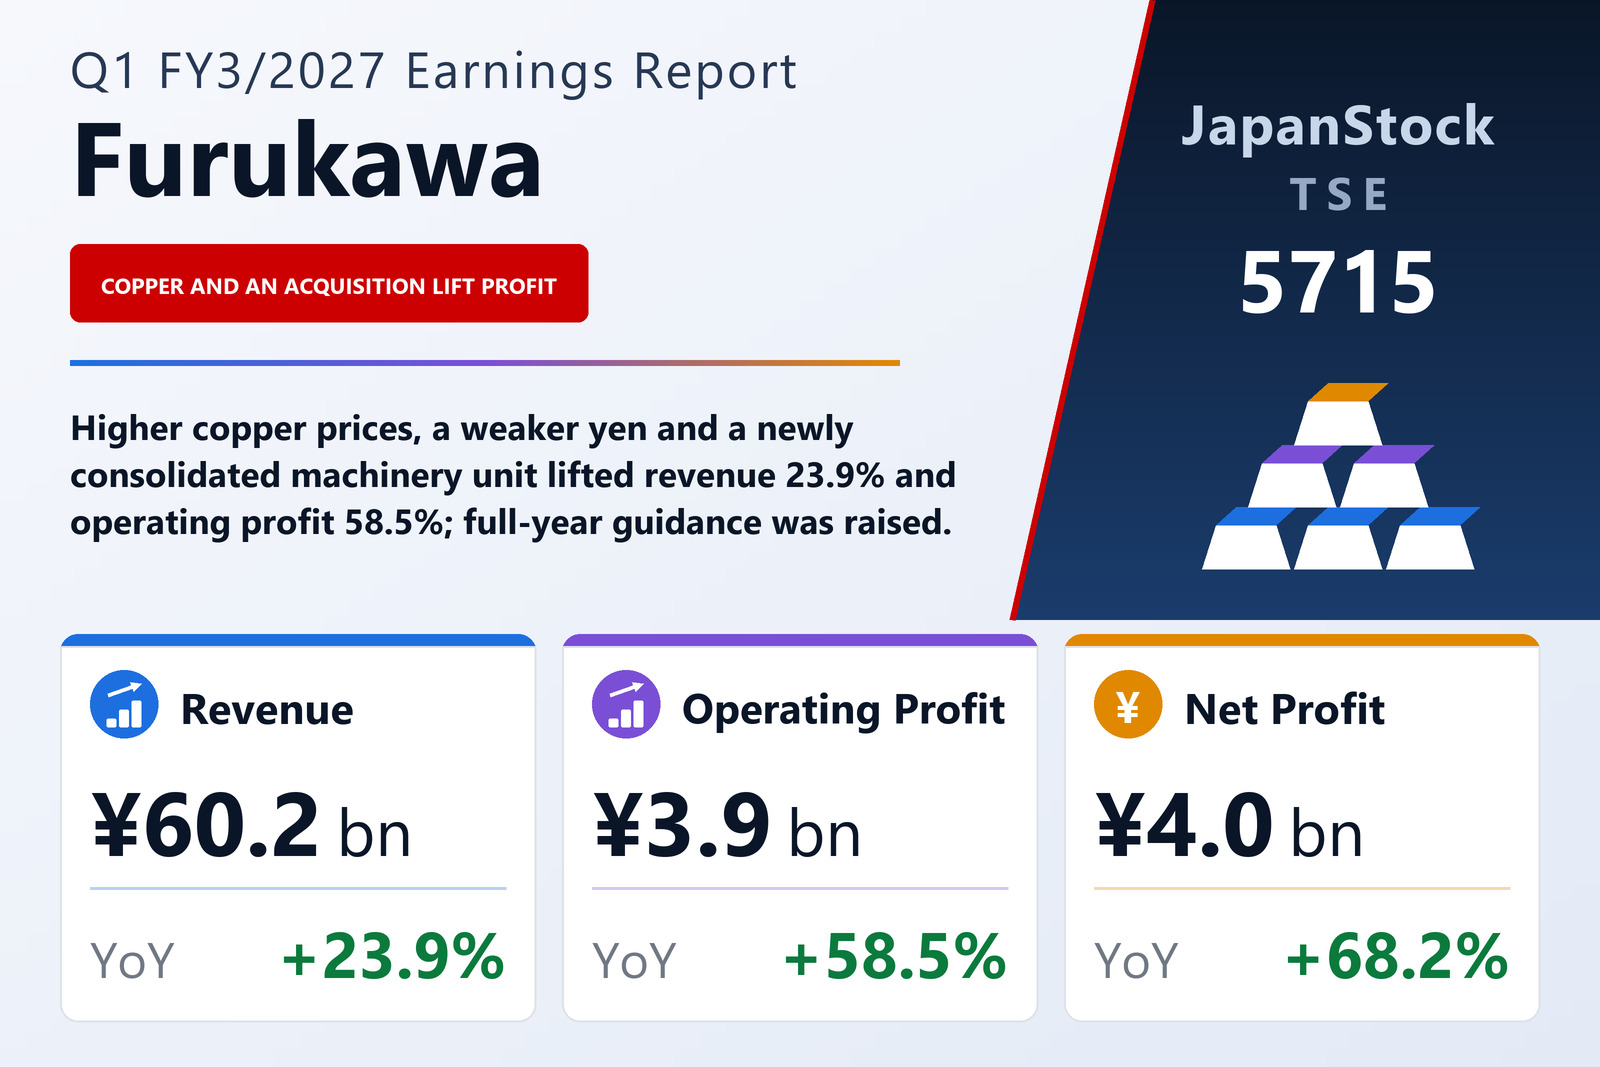
Copper, a weaker yen and an acquisition drove a 23.9% rise in revenue
Furukawa Co., Ltd. (TSE: 5715), the Tokyo-based group whose businesses span machinery, metals and electronic and chemical materials, published consolidated first-quarter results for the three months from April 1 to June 30, 2026 on August 13, 2026 under Japanese GAAP. Revenue rose 23.9% to ¥60,220 million, operating profit 58.5% to ¥3,900 million, ordinary profit 17.9% to ¥4,614 million and profit attributable to owners of the parent 68.2% to ¥4,041 million. Earnings per share were ¥124.62 against ¥70.23, up 77.4% — faster than net profit because the average number of shares outstanding fell to about 32.43 million from 34.22 million.
Part of the growth was bought rather than earned. During the quarter Furukawa brought two newly acquired companies into consolidation and reports them as a new machinery segment, which contributed ¥4,617 million of revenue and ¥153 million of segment profit with no prior-year comparison. Excluding it, revenue would have been about ¥55,603 million, a rise of roughly 14.4%. The rest came largely from metal prices and the currency: the average copper price the company cites rose to $13,324 a tonne from $9,519, and the average yen rate weakened to ¥159.5 per dollar from ¥144.6.
Gross margin widened, but costs grew faster than revenue
Cost of sales rose 21.2% to ¥49,787 million, a little slower than revenue, so gross profit rose 39.1% to ¥10,433 million and the gross margin widened from 15.4% to 17.3%. Selling, general and administrative expenses grew faster than revenue, by 29.6% to ¥6,533 million, which absorbed part of that gain: the operating margin improved from 5.1% to 6.5%, a smaller step than the gross margin. Unallocated corporate costs rose to ¥332 million from ¥161 million, and the filing says they include costs related to the share acquisition.
Below the operating line the picture reverses. Equity-method investment income fell to ¥710 million from ¥1,426 million and interest expense rose to ¥198 million from ¥130 million, so ordinary profit grew only 17.9%, a third of the operating rate. Pre-tax profit rose 18.0% to ¥4,606 million, but total income taxes fell to ¥474 million from ¥1,449 million, including a deferred-tax credit of ¥774 million against a charge of ¥1,136 million a year earlier; that is what lifted net profit by 68.2%. The filing does not explain the lower tax charge. Comprehensive income reached ¥15,399 million against ¥3,444 million, mostly an ¥11,466 million gain in the valuation of securities held.
Metals and materials led; the older machinery lines were mixed
Metals, the largest segment, grew revenue 19.4% to ¥28,541 million and nearly doubled profit to ¥1,719 million from ¥864 million. The overseas copper price opened the quarter at $12,270 a tonne, briefly topped $14,000 in mid-May and ended at $13,341. Electrolytic copper output fell by 1,949 tonnes to 9,037 tonnes and sales volume also declined, but higher prices and the weaker yen lifted revenue; the company puts the metal-price effect in the segment's profit at ¥1.25 billion, of which ¥1.11 billion came from copper. Electronic Materials rose 34.5% to ¥2,036 million, with profit up to ¥264 million from ¥22 million, on overseas demand for high-purity arsenic used in MBE equipment and on aluminium nitride ceramics for semiconductor production equipment. Chemicals rose 32.9% to ¥3,504 million, with profit of ¥495 million against ¥192 million, as copper oxide for package substrates, driven mainly by the AI server market, and cuprous oxide for ship-bottom paint both sold at higher prices.
The machinery lines moved in different directions. Rock Drills grew revenue 17.4% to ¥9,306 million on hydraulic crawler drills and hydraulic breakers for North America, but domestic sales fell and profit declined 21.2% to ¥602 million, which the filing attributes to the lower domestic revenue and a larger elimination of unrealised profit on inventory in consolidation. Cranes rose 4.6% to ¥7,091 million on product mix at home and shipments to Southeast Asia and of mini crawler cranes to North America, and profit more than tripled to ¥495 million. Industrial Machinery fell 18.6% to ¥3,445 million on lower bridge-construction progress and pump-plant sales, with profit down to ¥162 million from ¥336 million, though its order backlog stood at ¥12.1 billion against ¥8.6 billion a year earlier. Real Estate rose 16.1% to ¥641 million on higher sales-linked rent at its main commercial building in Tokyo's Muromachi district. The company changed how it allocates corporate costs to segments from this quarter and restated the prior-year segment figures on the new basis.
The acquisition and higher inventories enlarged the balance sheet
Total assets rose 19.3% to ¥324,973 million from ¥272,376 million at March 31, 2026. The company attributes the increase mainly to receivables, work in progress and fixed assets brought in by the new unit, to raw materials and supplies, which rose to ¥31,998 million from ¥16,959 million mainly in Metals, and to investment securities, which rose to ¥59,231 million from ¥41,051 million on higher share prices. Interest-bearing debt rose ¥21,829 million to ¥79,152 million, with short-term borrowings up to ¥30,645 million from ¥11,008 million. Net assets rose 11.6% to ¥167,686 million, but because assets grew faster the equity ratio fell from 54.1% to 49.5%.
Guidance raised on copper gains and a land sale in Australia
Furukawa raised both its half-year and full-year forecasts against those published on May 12, 2026; this filing gives only the new figures. For the six months to September 30 it now expects revenue of ¥126,200 million (+29.3%), operating profit of ¥5,600 million (+33.1%) and net profit of ¥8,300 million (+69.2%). For the full year FY3/2027 it expects revenue of ¥259,000 million (+22.7%), operating profit of ¥10,000 million (−11.5%), ordinary profit of ¥9,700 million (−29.4%) and net profit of ¥14,500 million (+13.5%), or ¥447.11 per share. The company cites price-difference gains from higher copper prices in Metals and stronger results in Electronic Materials, Chemicals and Real Estate. The net-profit figure also includes an expected extraordinary gain of about ¥6,000 million on the completed sale of a former smelter site in Australia held by its subsidiary PKC Properties Pty. Ltd., as announced on August 12, plus gains from partly selling shares held as strategic holdings.
The full-year operating guidance is conservative against the first quarter. The ¥3,900 million just booked is 39% of the guided ¥10,000 million, leaving about ¥6,100 million for the remaining nine months. The segment forecasts show where the slowdown is assumed: Metals is guided to ¥1,200 million of full-year profit after earning ¥1,719 million in the first quarter alone, which implies a loss in the rest of the year; the filing does not explain that assumption. The dividend forecast is unchanged at ¥80.00 a share for the year, split into ¥40.00 at the half and ¥40.00 at the year-end, the same annual total as FY3/2026.
| Metric | Q1 FY3/2027 | Q1 FY3/2026 | Change |
|---|---|---|---|
| Revenue (¥ million) | 60,220 | 48,592 | +23.9% |
| Gross profit (¥ million) | 10,433 | 7,503 | +39.1% |
| Gross margin | 17.3% | 15.4% | +1.9 pt |
| SG&A expenses (¥ million) | 6,533 | 5,042 | +29.6% |
| Operating profit (¥ million) | 3,900 | 2,460 | +58.5% |
| Operating margin | 6.5% | 5.1% | +1.4 pt |
| Ordinary profit (¥ million) | 4,614 | 3,915 | +17.9% |
| Net profit attrib. to owners of parent (¥ million) | 4,041 | 2,403 | +68.2% |
| Comprehensive income (¥ million) | 15,399 | 3,444 | +347.0% |
| EPS (¥) | 124.62 | 70.23 | +77.4% |
| Industrial Machinery — revenue (¥ million) | 3,445 | 4,233 | −18.6% |
| Industrial Machinery — segment profit (¥ million) | 162 | 336 | −51.8% |
| Rock Drills — revenue (¥ million) | 9,306 | 7,924 | +17.4% |
| Rock Drills — segment profit (¥ million) | 602 | 764 | −21.2% |
| Cranes — revenue (¥ million) | 7,091 | 6,781 | +4.6% |
| Cranes — segment profit (¥ million) | 495 | 150 | +230.0% |
| Newly Acquired Machinery Unit — revenue (¥ million) | 4,617 | — | new |
| Newly Acquired Machinery Unit — segment profit (¥ million) | 153 | — | new |
| Metals — revenue (¥ million) | 28,541 | 23,908 | +19.4% |
| Metals — segment profit (¥ million) | 1,719 | 864 | +99.0% |
| Electronic Materials — revenue (¥ million) | 2,036 | 1,514 | +34.5% |
| Electronic Materials — segment profit (¥ million) | 264 | 22 | +1,100.0% |
| Chemicals — revenue (¥ million) | 3,504 | 2,637 | +32.9% |
| Chemicals — segment profit (¥ million) | 495 | 192 | +157.8% |
| Real Estate — revenue (¥ million) | 641 | 552 | +16.1% |
| Real Estate — segment profit (¥ million) | 280 | 203 | +37.9% |
| Total assets (¥ million) | 324,973 | 272,376 | +19.3% |
| Net assets (¥ million) | 167,686 | 150,201 | +11.6% |
| Equity ratio | 49.5% | 54.1% | −4.6 pt |
| Interest-bearing debt (¥ million) | 79,152 | 57,323 | +38.1% |
| FY3/2027 guidance — revenue (¥ million) | 259,000 | — | +22.7% |
| FY3/2027 guidance — operating profit (¥ million) | 10,000 | — | −11.5% |
| FY3/2027 guidance — ordinary profit (¥ million) | 9,700 | — | −29.4% |
| FY3/2027 guidance — net profit (¥ million) | 14,500 | — | +13.5% |
| FY3/2027 guidance — EPS (¥) | 447.11 | — | — |
| Annual dividend per share (¥) | 80.00 | 80.00 | unchanged |
JapanStockPulse provides informational content only and does not constitute investment advice. Figures are taken from the company's published earnings short report and may be subject to subsequent revision.