Revenue rose 2.8%, cost of sales 5.8% — and the gross line turned negative
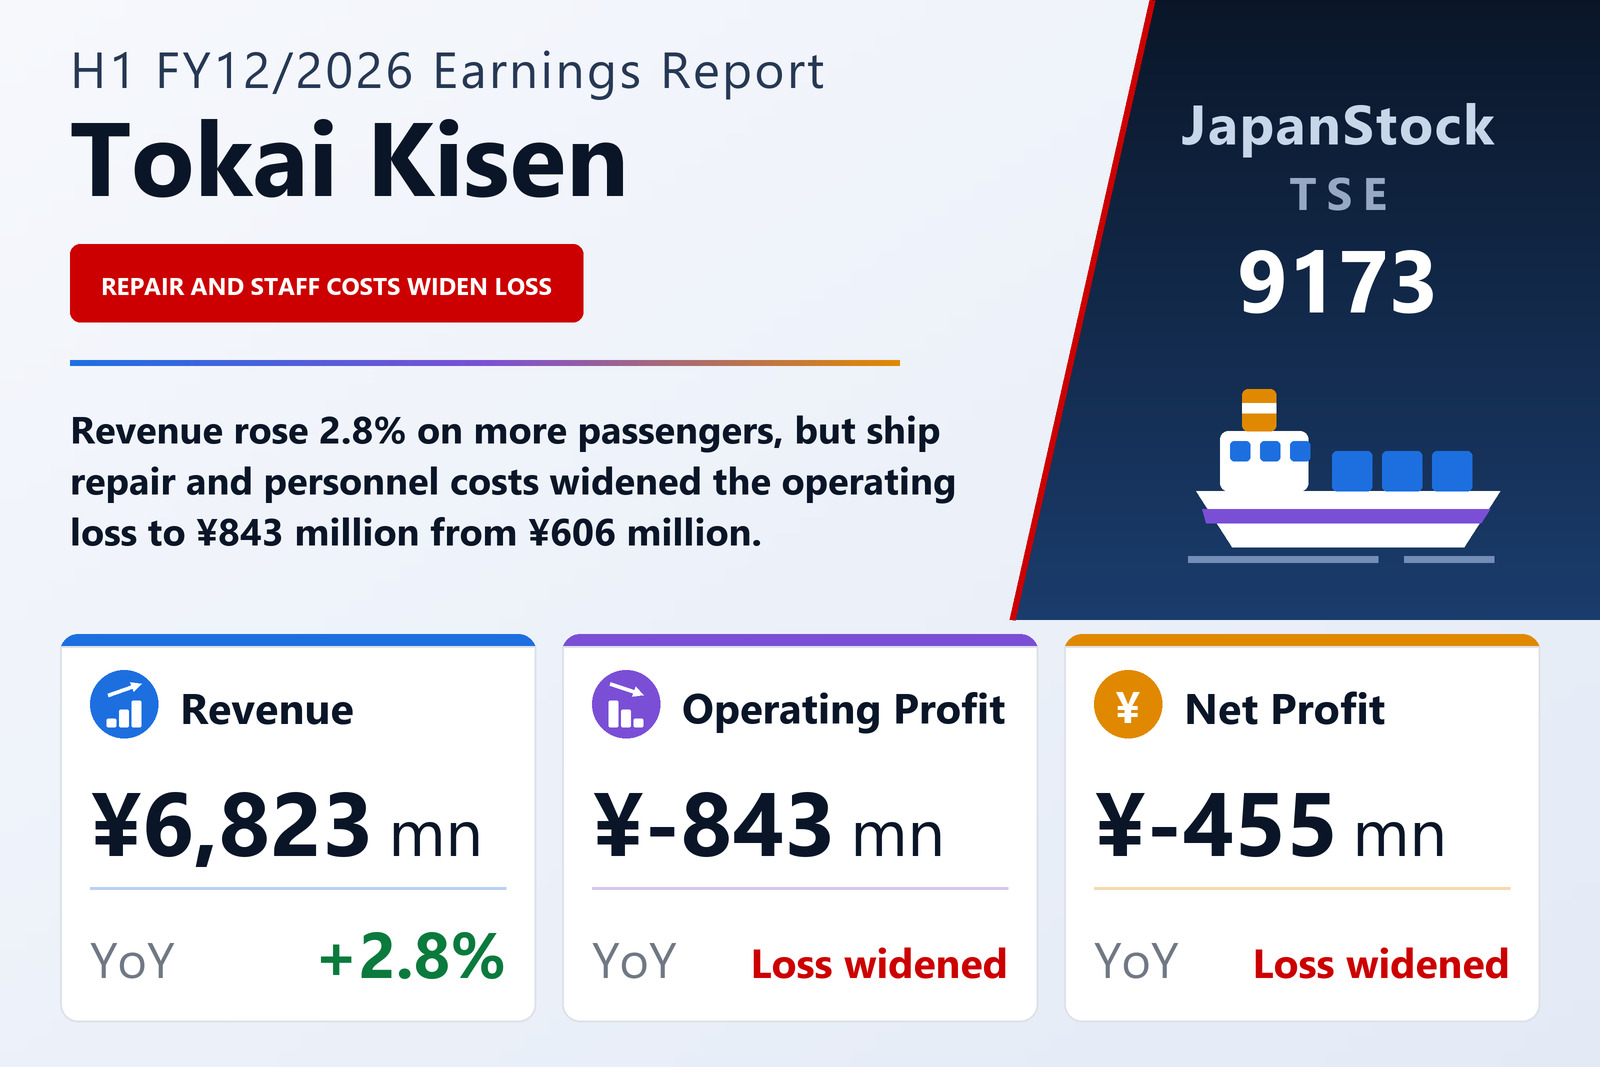
Tokai Kisen Co., Ltd. (TSE: 9173), which runs passenger and cargo sea routes to the Tokyo islands, including Izu Oshima and Hachijojima, published consolidated results for the first half of FY12/2026, the six months from January 1 to June 30, 2026, on August 13, 2026 under Japanese GAAP. Revenue rose 2.8% to ¥6,823 million, but the operating loss widened to ¥843 million from ¥606 million, the ordinary loss to ¥846 million from ¥632 million and the net loss attributable to owners of the parent to ¥455 million from ¥373 million, a loss of ¥207.40 per share against ¥170.27. The company is listed on the Tokyo Stock Exchange.
The arithmetic is short. Revenue grew by ¥183 million, while cost of sales grew by ¥376 million, or 5.8%, to ¥6,878 million, so a gross profit of ¥138 million a year earlier became a gross loss of ¥54 million, a swing of ¥192 million. Selling, general and administrative expenses rose 6.0% to ¥789 million, another ¥45 million, and together those two moves account exactly for the ¥237 million by which the operating loss widened. The pressure sits in the core shipping line: marine operating revenue rose 2.4% to ¥5,927 million while marine operating expenses rose 6.0% to ¥6,035 million. The filing names higher ship repair costs and personnel costs as the cost increases in the shipping business.
More passengers and a little more cargo did not cover the cost increase
The Marine Transportation segment, which accounts for the great majority of revenue, took in ¥5,965 million, up 2.4% including intersegment sales, and its segment loss widened to ¥672 million from ¥420 million. Passenger numbers rose to 289,000 from 277,000. The company says it invited influencers to the Camellia Festival, Izu Oshima's largest event, to reach younger travellers, pushed planned tickets to individual customers, and sold weekday return tickets and tour packages to stimulate demand in the off-peak period. Cargo volume edged up to 140,000 tonnes from 139,000, with daily-life goods steady and construction-related cargo, mainly bound for Hachijojima, increasing.
The filing frames the backdrop plainly. Inbound tourism is rising across Japan, but it says the spill-over to the Tokyo islands has been limited, and that recruiting crew for the island routes and staff on the islands has become even harder amid inflation and labour shortages. Group revenue also includes ¥616 million of other revenue against ¥631 million, which the segment note describes as subsidy income and similar items needed to keep the business running, outside revenue from contracts with customers; ¥579 million of it sits in Marine Transportation.
The three smaller businesses all improved
The other three segments grew revenue and profit. Trading & Food Service rose 5.0% to ¥633 million with segment profit of ¥52 million against ¥44 million: cement sales fell because public works were delayed, but onboard vending-machine and restaurant income held firm. The Hotel segment, a hot-spring hotel on Izu Oshima, rose 11.9% to ¥179 million and earned ¥11 million against ¥3 million, on more overnight and day guests and on staffing changes the company says improved labour productivity. Bus Transport on Izu Oshima rose 10.6% to ¥167 million, with profit of ¥25 million against ¥18 million, helped by a route-bus fare revision from January and strong festival traffic; the filing notes that the route buses receive ongoing support from Oshima town.
Together those three earned ¥88 million against ¥65 million, an improvement of ¥23 million, set against the ¥252 million deterioration in Marine Transportation. Unallocated corporate costs and eliminations were ¥261 million against ¥252 million, bringing the total to the group operating loss of ¥843 million.
Below the operating line: a scrapped jetfoil and a tax credit
Non-operating income of ¥75 million, including ¥14 million of subsidy income, was matched by ¥78 million of non-operating expenses, mostly ¥71 million of interest, so the ordinary loss came to ¥846 million. Extraordinary gains were ¥111 million against ¥98 million: ¥66 million of government subsidies and ¥45 million of other gains, which the filing ties to the sale of a high-speed jetfoil for scrap. Extraordinary losses of ¥65 million were reduction entries that lower the book cost of subsidised assets. The pre-tax loss was ¥800 million against ¥632 million. Income taxes were a net credit of ¥273 million, chiefly a ¥292 million deferred-tax adjustment, leaving a net loss of ¥527 million, of which non-controlling interests bore ¥72 million against ¥30 million. The comprehensive loss was ¥650 million against ¥321 million, as unrealised gains on securities fell by ¥122 million after rising ¥83 million a year earlier.
Cash rose as payables swelled; the equity ratio fell to 22.2%
Total assets rose by ¥277 million to ¥21,021 million from December 31, 2025. Cash and deposits rose ¥584 million to ¥4,467 million and deferred tax assets ¥340 million, while property, plant and equipment fell ¥411 million, mainly on ship depreciation, and investment securities ¥170 million. Liabilities rose ¥949 million to ¥14,769 million, led by a ¥1,012 million rise in trade payables, including ship inspection costs, and a ¥505 million rise in other current liabilities, while long-term borrowings fell ¥564 million. Net assets fell ¥672 million to ¥6,252 million as retained earnings dropped ¥477 million, and the equity ratio slipped from 25.4% to 22.2%.
Operating cash flow was ¥1,365 million against ¥270 million. The filing attributes it mainly to the ¥1,012 million increase in payables, ¥597 million of depreciation and ¥543 million of other items, which outweighed the ¥800 million pre-tax loss, so the inflow rests largely on working capital rather than earnings. Investing activities used ¥139 million, chiefly ¥210 million of capital spending offset by ¥84 million of subsidies received, and financing used ¥640 million, mainly ¥582 million of long-term loan repayments and ¥21 million of dividends. Cash and equivalents ended the half at ¥4,131 million, up ¥584 million.
Guidance unchanged, and the busy season has to deliver it
Tokai Kisen left its full-year FY12/2026 forecast, published on February 12, 2026, unchanged: revenue of ¥14,820 million (+3.7%), operating profit of ¥260 million (−50.3%), ordinary profit of ¥260 million (−41.6%) and net profit attributable to owners of the parent of ¥160 million (−56.5%), or ¥72.91 per share. Set against the first half, that implies second-half revenue of about ¥7,997 million and operating profit of roughly ¥1,103 million, after a first-half loss of ¥843 million. The filing describes the third quarter onward as the company's busiest period for passengers, and the forecast depends on it.
The dividend is undecided. The company paid a year-end dividend of ¥10.00 for FY12/2025, and says the FY12/2026 year-end amount remains undetermined because of uncertainty in the operating environment; it will assess conditions from the third quarter, its peak season, and disclose a figure promptly.
| Metric | H1 FY12/2026 | H1 FY12/2025 | Change |
|---|---|---|---|
| Revenue (¥ million) | 6,823 | 6,640 | +2.8% |
| Gross profit (¥ million) | −54 | 138 | profit to loss |
| SG&A expenses (¥ million) | 789 | 744 | +6.0% |
| Operating profit (¥ million) | −843 | −606 | loss widened |
| Ordinary profit (¥ million) | −846 | −632 | loss widened |
| Extraordinary gains (¥ million) | 111 | 98 | +13.3% |
| Pre-tax profit (¥ million) | −800 | −632 | loss widened |
| Net profit attrib. to owners of parent (¥ million) | −455 | −373 | loss widened |
| EPS (¥) | −207.40 | −170.27 | loss widened |
| Marine Transportation — revenue (¥ million) | 5,965 | 5,828 | +2.4% |
| Marine Transportation — segment profit (¥ million) | −672 | −420 | loss widened |
| Trading & Food Service — revenue (¥ million) | 633 | 603 | +5.0% |
| Trading & Food Service — segment profit (¥ million) | 52 | 44 | +18.2% |
| Hotel — revenue (¥ million) | 179 | 160 | +11.9% |
| Hotel — segment profit (¥ million) | 11 | 3 | +266.7% |
| Bus Transport — revenue (¥ million) | 167 | 151 | +10.6% |
| Bus Transport — segment profit (¥ million) | 25 | 18 | +38.9% |
| Operating cash flow (¥ million) | 1,365 | 270 | +405.6% |
| Total assets (¥ million) | 21,021 | 20,744 | +1.3% |
| Net assets (¥ million) | 6,252 | 6,924 | −9.7% |
| Equity ratio | 22.2% | 25.4% | −3.2 pt |
| FY12/2026 guidance — revenue (¥ million) | 14,820 | — | +3.7% |
| FY12/2026 guidance — operating profit (¥ million) | 260 | — | −50.3% |
| FY12/2026 guidance — ordinary profit (¥ million) | 260 | — | −41.6% |
| FY12/2026 guidance — net profit (¥ million) | 160 | — | −56.5% |
| FY12/2026 guidance — EPS (¥) | 72.91 | — | n.m. |
| Annual dividend per share (¥) | — | 10.00 | n.m. |
JapanStockPulse provides informational content only and does not constitute investment advice. Figures are taken from the company's published earnings short report and may be subject to subsequent revision.