Seat growth, cross-sell and a price rise, compounding at once
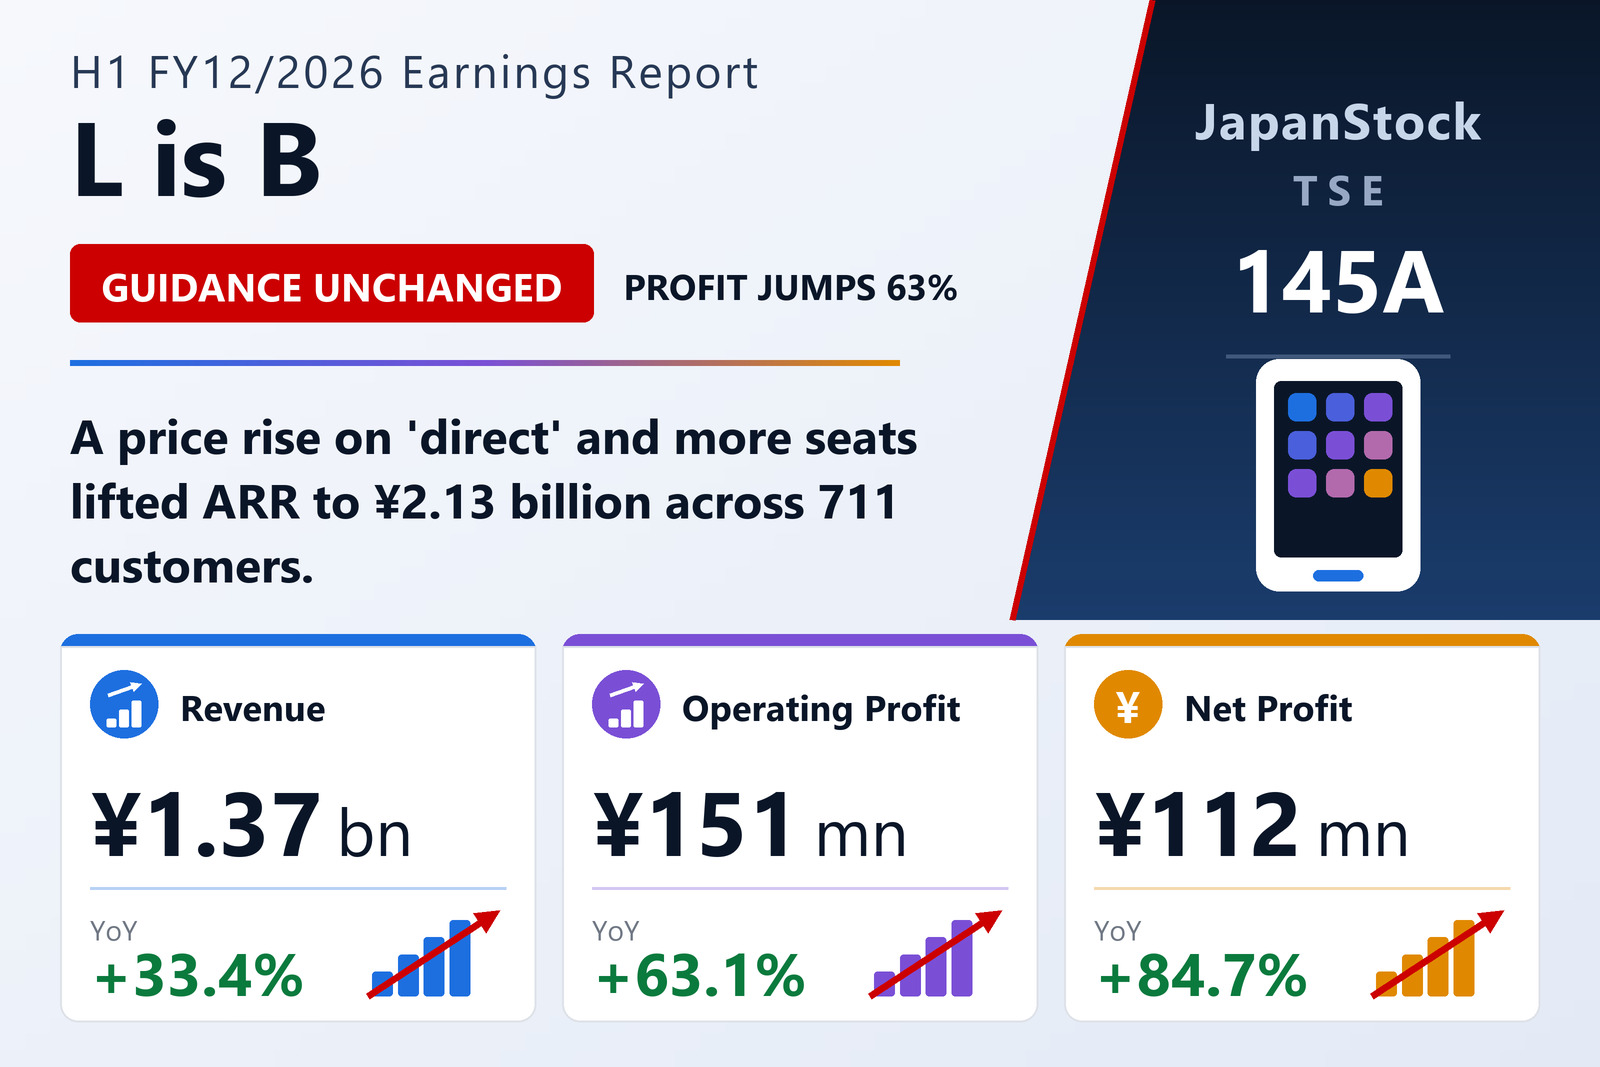
L is B Corporation (TSE Growth: 145A), the Tokyo-listed developer of the field business chat platform "direct" and a company that describes its mission as making people smile with ideas and technology, disclosed consolidated results for the first half of the year to December 2026 — January 1 to June 30 — under Japanese GAAP on August 14, 2026. Revenue came in at ¥1,371 million, up 33.4% from ¥1,028 million a year earlier. Operating profit rose 63.1% to ¥151 million, ordinary profit 62.3% to ¥133 million, and net profit attributable to owners of parent 84.7% to ¥112 million. Comprehensive income matched net profit at ¥112 million. Basic earnings per share were ¥21.95 against ¥11.90 a year earlier, an increase of 84.5%; no diluted figure is presented because the company has no dilutive potential shares outstanding.
The half's growth came from three sources acting together rather than one. The company grew the installed ID count on its core "direct" service, pushed cross-sell of the adjacent products that plug into it, and — this is the piece that flows straight to margin — implemented a price revision on "direct" in April 2026, widening the customer base and raising revenue per account at the same time. On top of that organic movement, IU BIM STUDIO Inc., subsidiarized on October 31, 2025, contributed to consolidated results for the whole of this half year, where a year ago it contributed nothing at all. Investors should note that the purchase price allocation for that acquisition remains provisional and has not been completed, so the goodwill and intangible balances carried against it may still be restated.
ARR of ¥2.13 billion, 711 customers, and what "direct" now sits alongside
L is B runs on stock revenue by design, and it reports the KPIs that go with that model. At June 30, annual recurring revenue stood at ¥2,127.8 million — calculated, per the company's own definition, as the period-end month's stock revenue multiplied by twelve. The stock-revenue ratio was 95.3% and the number of contracted companies reached 711, counted as paying contracting entities excluding OEM arrangements, with a single contract counted once even where several affiliated firms use it. That last definition matters: 711 understates the number of organisations actually on the platform, because a general contractor's subcontractors typically ride the main contract.
The revenue disaggregation in the segment note splits the half differently, on a cumulative rather than period-end basis. Stock revenue was ¥1,199.0 million, up 41.4% from ¥848.0 million, while professional services revenue was ¥172.7 million, down 4.2% from ¥180.2 million. On that six-month cumulative basis stock revenue is 87.4% of the total — the 95.3% KPI is a point-in-time measure taken on the final month, so the two figures are not directly comparable, but both point the same way: the flow-revenue component is shrinking in absolute terms while the recurring base grows at more than 40%. Around "direct" itself, the company pushed adoption of Tag Shot / Tag Album, its camera-and-cloud photo-sharing service for job sites, and Knowledge Video, which lets field workers capture and share operational know-how as short video rather than written manuals.
Construction is the target market, and its labour crunch is the tailwind
The company's primary vertical is construction, and its read on that market is that the pressure is structural rather than cyclical. Building demand is expected to stay firm, but contractors face a deepening labour shortage, sharply higher materials costs, and — the specifically Japanese constraint — the statutory overtime cap that now applies to the construction industry. With fewer hours legally available per worker, the sector cannot solve rising demand by working longer, so productivity improvement has become the binding management issue and interest in digitising the job site has risen accordingly. That is a demand driver that does not switch off with the macro cycle, which is the more important point for a company whose revenue is 95% recurring: churn risk falls when the customer's regulatory obligation, not merely its budget, is what the software addresses.
L is B frames its own edge as resolution — understanding customer problems in high detail and reflecting them into product quickly. That is a plausible claim for a vendor selling into a vertical where the buyer's workflow is idiosyncratic and the incumbent alternative is a consumer messaging app used informally, but it is also the claim every field-DX vendor makes, and the KPI to watch is not ARR growth in a half where a price rise took effect but the contracted-company count in the halves after it.
Margins: gross margin down, operating margin up
The margin story is a trade, and it went the right way. Cost of sales rose 44.4% to ¥517.1 million, outpacing revenue growth of 33.4%, so gross margin fell to 62.3% from 65.2% — a 2.9 point decline that reflects the consolidation of IU BIM STUDIO's more service-weighted cost base. Against that, selling, general and administrative expenses grew only 21.8% to ¥703.6 million, well below revenue growth, so the SG&A ratio dropped 4.9 points to 51.3% from 56.2%. The net effect was an operating margin of 11.0%, up from 9.0% — operating leverage of the ordinary kind, where the fixed cost base of a SaaS business is spread across a larger top line.
Below the operating line the picture is less flattering. Ordinary profit of ¥133 million is ¥17 million lower than operating profit, principally because of ¥11.9 million of interest expense and an ¥8.4 million loss on investment partnership operations against just ¥3.2 million of non-operating income. Net profit nonetheless grew faster than any other line, at 84.7%, and the reason is tax rather than trading: total income taxes of ¥22.3 million on pre-tax profit of ¥135.0 million represent an effective rate of just 16.5%, held down by a ¥16.0 million increase in deferred tax assets. That is a real cash benefit but not a repeatable one, and the 84.7% net profit growth should be read with the 63.1% operating profit growth as the underlying rate.
Guidance unchanged, and a first half already running ahead of it
L is B left its full-year FY12/2026 forecast exactly where it was set on February 13, 2026: revenue of ¥2,823 million, up 32.4%, operating profit of ¥266 million, up 57.8%, ordinary profit of ¥240 million, up 63.3%, net profit attributable to owners of parent of ¥180 million, up 30.2%, and EPS of ¥35.11. Measured against that plan, the first half delivered 48.6% of the revenue target — almost exactly on a straight-line pace — but 56.8% of the operating profit target, 55.7% of the ordinary profit target and 62.6% of the net profit target.
In other words the company is tracking to plan on the top line and ahead of it on every profit line, while leaving the plan untouched. The implied second half carries revenue of ¥1,452 million against operating profit of only ¥115 million, a 7.9% margin versus the 11.0% just delivered — so either management is holding back a cushion, or it expects to spend the H1 outperformance on hiring and product in the second half. The full-year net profit forecast of ¥180 million, up 30.2%, is the conservative-looking line: it sits below the growth rate guided for operating profit, consistent with the H1 tax benefit not recurring.
One drag to keep in view is the investment business segment, which posted a loss of ¥5.4 million on fund operating costs while the company sourced and executed new startup investments intended to generate synergy or financial return. The DX Solution segment — effectively the whole operating business — produced revenue of ¥1,371.7 million and segment profit of ¥156.4 million, up 61.9%; the two segments sum to the reported ¥151.0 million operating profit.
Balance sheet: debt repaid, equity ratio up 3.5 points
Total assets were near flat at ¥3,443 million, up ¥18 million from ¥3,425 million at December 31, 2025 — but the composition beneath that stillness moved. Investment securities rose ¥35 million, software work-in-progress ¥33 million and deferred tax assets ¥16 million, while goodwill amortised down ¥27 million, insurance reserves fell ¥21 million and capitalised software ¥16 million. The liability side is where the half's real work shows: total liabilities fell ¥112 million to ¥1,465 million, driven by ¥99 million of long-term borrowing repayment plus a ¥30 million short-term repayment, partly offset by a ¥70 million increase in contract liabilities — which, for a subscription business, is deferred revenue and therefore a leading indicator rather than a burden.
Net assets rose ¥130 million to ¥1,978 million, of which ¥112.7 million is the half's retained earnings and roughly ¥17.7 million came from share issuance splitting evenly between capital and capital surplus (shares outstanding rose to 5,147,665 from 5,124,800). The equity ratio improved to 57.4% from 53.9%, a gain of 3.5 percentage points achieved by paying down debt rather than by raising equity. Cash and equivalents ended at ¥1,374 million, down ¥40 million: operating cash flow of +¥141 million and investing outflow of −¥43 million were more than absorbed by −¥138 million of financing outflow, essentially all of it debt repayment.
No dividend is planned — nil for FY2025, nil at the FY2026 interim and nil in the full-year forecast — which is the expected posture for a TSE Growth company reinvesting through a scaling phase. As a second-quarter tanshin, these statements are not subject to audit or review by a certified public accountant or audit corporation. The company plans an earnings briefing for individual investors, and filed its semi-annual report on the same day as the results.
| Metric | H1 FY12/2026 | H1 FY12/2025 | Change |
|---|---|---|---|
| Revenue (¥ million) | 1,371 | 1,028 | +33.4% |
| Operating profit (¥ million) | 151 | 92 | +63.1% |
| Ordinary profit (¥ million) | 133 | 82 | +62.3% |
| Net profit attrib. to owners of parent (¥ million) | 112 | 60 | +84.7% |
| Basic EPS (¥) | 21.95 | 11.90 | +84.5% |
| Operating margin | 11.0% | 9.0% | +2.0 pt |
| ARR at period end (¥ million) | 2,127.8 | — | — |
| Contracted companies | 711 | — | — |
| Total assets (¥ million; vs Dec 31, 2025) | 3,443 | 3,425 | +0.5% |
| Net assets (¥ million; vs Dec 31, 2025) | 1,978 | 1,847 | +7.1% |
| Equity ratio (vs Dec 31, 2025) | 57.4% | 53.9% | +3.5 pt |
| Dividend per share (¥) | 0.00 | 0.00 | — |
JapanStockPulse provides informational content only and does not constitute investment advice. Figures are taken from the company's published earnings short report and may be subject to subsequent revision.