A quarter more revenue, and every profit line higher
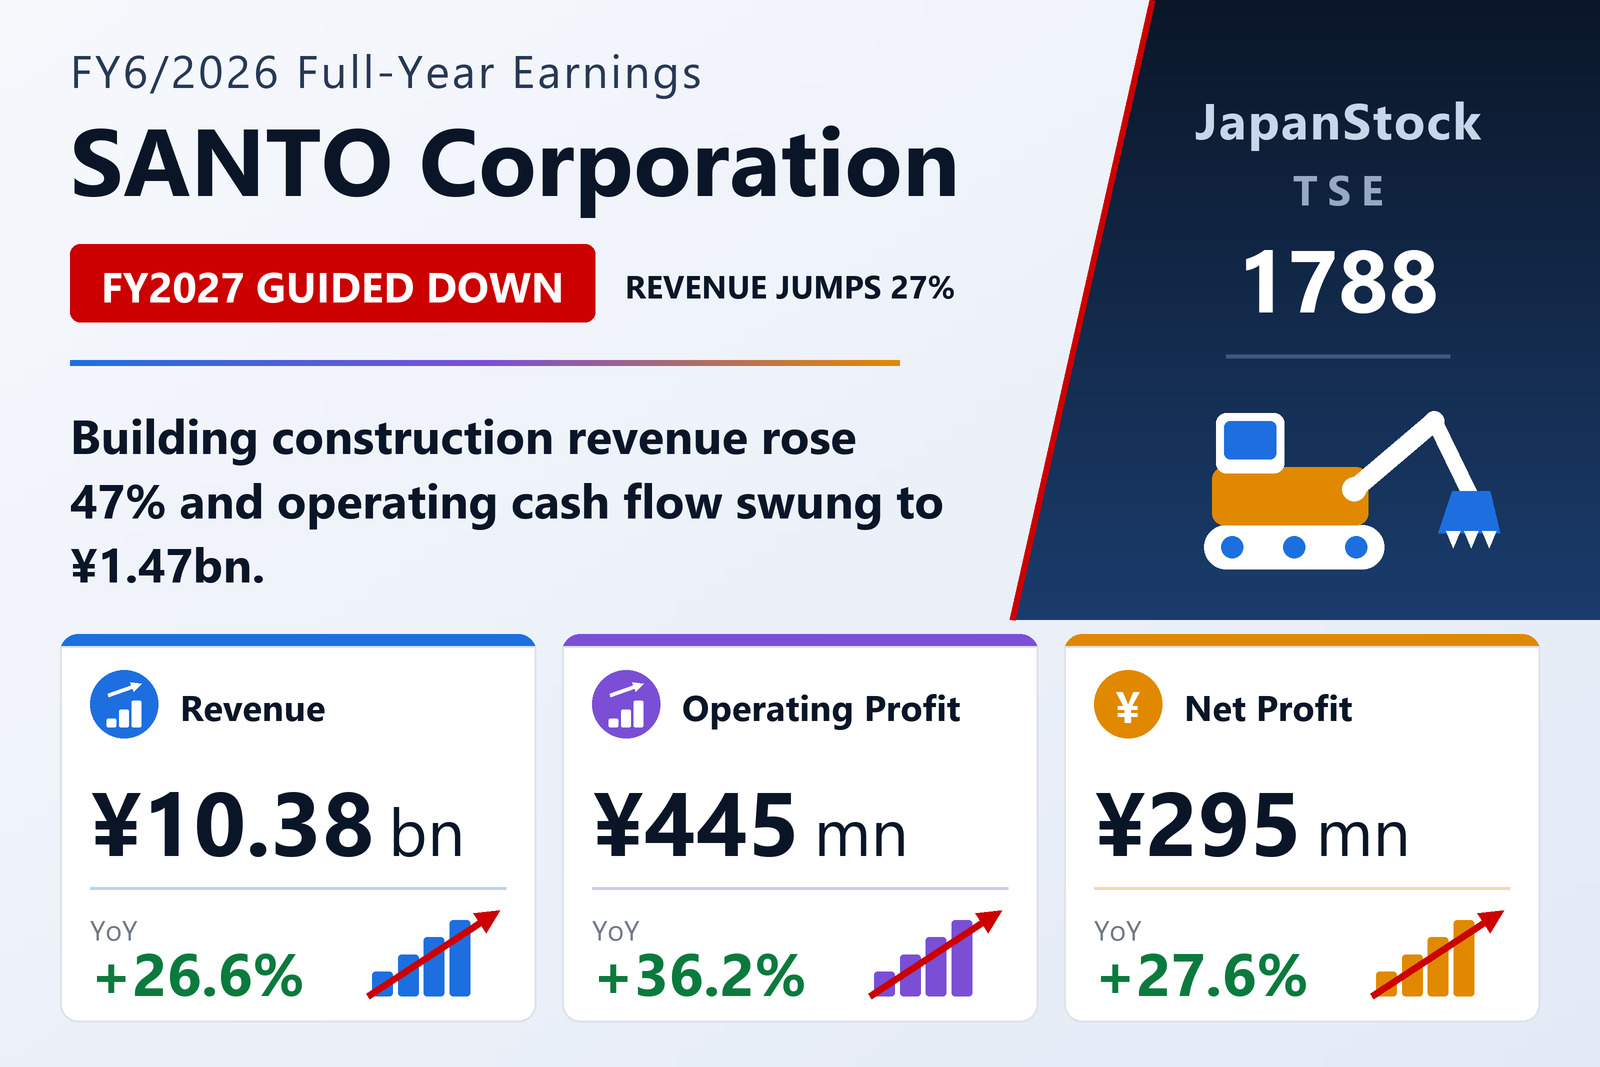
SANTO Corporation (TSE: 1788), a general contractor headquartered in Shiga Prefecture that builds civil engineering works and buildings across the Lake Biwa region, released consolidated results for the fiscal year ended June 30, 2026 under Japanese GAAP on August 14, 2026. Revenue rose 26.6% to ¥10,380 million from ¥8,199 million, taking the group past the ¥10 billion mark for the first time in its recent history. Operating profit rose 36.2% to ¥445 million, ordinary profit 34.9% to ¥456 million, and net profit attributable to owners of parent 27.6% to ¥295 million. Earnings per share were ¥471.26 against ¥371.94 a year earlier.
The improvement was broad. Return on equity climbed to 8.2% from 7.1%, ordinary profit on total assets to 8.1% from 7.0%, and the operating margin to 4.3% from 4.0%. Comprehensive income, which captures the mark-to-market on the group's securities portfolio, rose 72.3% to ¥457 million — well ahead of the ¥298 million of net profit including minority interests, the ¥160 million gap being unrealised valuation gains on investment securities rather than anything the operating business produced.
Management attributes the year to a construction market that stayed busy. Public investment held firm and private capital spending remained strong, keeping demand at a generally high level, while the group itself pushed digital transformation through its back office and its sites to lift productivity, and leaned on the local subcontracting partnerships that a regional contractor lives or dies by. The counterweight is the one the whole Japanese construction industry is carrying: construction costs that remain stubbornly high, and a structural shortage of labour.
That counterweight is visible in the margin structure, and it is the most important detail in this release. Gross profit margin actually fell, to 11.7% from 12.3%, as cost of sales grew faster than revenue. The reason operating margin nonetheless improved is that selling, general and administrative expenses grew far more slowly than the top line — SG&A rose 12.4% to ¥767 million against revenue growth of 26.6%, cutting the SG&A ratio to 7.4% from 8.3%. In other words, this was an operating-leverage year, not a pricing year. Volume paid for the profit growth; the underlying build economics got slightly tighter.
Building construction was the swing factor; civil engineering was the ballast
SANTO reports three segments. Civil engineering — general civil works, underground technology and paving, weighted towards public-sector contracts — posted completed-works revenue of ¥5,270 million, up 12.2%, and segment profit of ¥343 million, up 25.7%, for a segment margin of 6.5% against 5.8%. This is the steady half of the business and it grew profitably.
The acceleration came from building construction — stores, welfare facilities and factories, weighted towards private-sector clients — where completed-works revenue jumped 46.9% to ¥5,068 million and segment profit more than tripled, up 220.8% to ¥90 million. That growth rate is arresting, but so is the level it starts from: even after tripling, the building segment earned a margin of just 1.8%, against 0.8% a year earlier. Building construction now contributes 48.8% of group revenue but only 20.1% of segment profit. A business mix shifting towards the thinner-margin segment is exactly the kind of change that shows up as a lower gross margin, and it is worth holding on to when reading next year's guidance.
The third segment, environmental development — environmental planning, surveying, design and supervision plus real-estate dealing — is small and moved the other way, with revenue down 20.5% to ¥42 million and segment profit down 51.5% to ¥13 million. At 0.4% of group revenue it is not material to the result, though its margin remains by far the highest of the three. The tanshin does not disclose orders received or order backlog, so investors have no forward book to read against the revenue line — the guidance is the only forward indicator on offer.
A ¥1.39 billion cash swing, and where it came from
The single most dramatic number in the release is cash generation. Operating cash flow was ¥1,468 million, against ¥79 million the previous year — an improvement of nearly ¥1.39 billion. Investing activities used ¥171 million (against ¥157 million), mainly ¥98 million on property, plant and equipment, and financing used ¥76 million (against ¥75 million), essentially the ¥62 million dividend payment. Cash and equivalents ended the year at ¥2,362 million, up ¥1,221 million, more than double the ¥1,141 million a year earlier.
The composition matters more than the headline. The company states plainly that the operating inflow was driven principally by a ¥590 million increase in advances received on uncompleted construction contracts — customer prepayments on jobs not yet finished. That is real cash, and for a contractor it is a genuine sign of a full order pipeline, but it is working-capital timing rather than earned profit: pre-tax profit was only ¥454 million, and depreciation added ¥80 million. Advances of this kind unwind as the underlying jobs complete, so an investor should not annualise a ¥1.47 billion operating cash flow off a ¥295 million bottom line.
A bigger balance sheet, proportionally less equity-funded
Total assets grew ¥1,147 million to ¥6,234 million. Current assets rose ¥850 million to ¥4,593 million, driven by the ¥1,251 million increase in cash and deposits, while fixed assets rose ¥297 million to ¥1,641 million, mainly a ¥226 million increase in investment securities that reflects market value rather than new outlay. On the other side, total liabilities rose ¥729 million to ¥2,386 million — current liabilities up ¥696 million to ¥2,246 million on that same ¥590 million of construction advances, with fixed liabilities up only ¥32 million to ¥139 million.
Net assets rose ¥418 million to ¥3,848 million, of which ¥233 million came from retained earnings and the balance from the securities revaluation reserve. Book value per share reached ¥6,055.93 from ¥5,439.51. And yet the equity ratio fell to 60.9% from 66.5%. That 5.6-point decline is not a weakening of the capital base — owners' equity itself rose 12.1% to ¥3,796 million — but simple arithmetic: total assets grew 22.6% while equity grew 12.1%, and the numerator of the gap is customer cash sitting on the liability side. A contractor holding more prepayments will always look less equity-funded. At 60.9% the balance sheet remains conservative by construction-sector standards, and the group carries only a modest short-term borrowing position, having drawn and repaid ¥305 million during the year.
Dividend raised to ¥130, with ¥60 of it explicitly special
SANTO declared a year-end dividend of ¥130.00 per share for FY6/2026, up from ¥100.00, for a total distribution of ¥81 million, a payout ratio of 27.6% and a dividend on net assets of 2.3%. The company pays only at year-end; there is no interim dividend. Crucially, the tanshin breaks the payment down: the ¥130.00 consists of an ordinary dividend of ¥70.00 and a special dividend of ¥60.00. The prior year's ¥100.00 was likewise ¥70.00 ordinary plus ¥30.00 special. The ordinary rate has therefore been flat at ¥70.00 for two years, and the entire increase came from a special payment that management has doubled but not committed to repeating.
It has, in fact, signalled the opposite. The FY6/2027 forecast dividend is ¥80.00, a cut of ¥50.00 from the year just reported, for an indicated payout ratio of 19.3%. The forecast is not broken into ordinary and special components in the release. Shareholders on the register at the June year-end will be paid from September 28, 2026, following the annual general meeting on September 25.
Guidance: more revenue, less profit
For the year to June 2027 the company forecasts revenue of ¥11,000 million, up 6.0%, but operating profit of ¥400 million, down 10.2%, ordinary profit of ¥400 million, down 12.4%, and net profit attributable to owners of parent of ¥260 million, down 11.9%, for EPS of ¥414.77. That combination implies an operating margin of 3.6%, down from 4.3% — giving back more than the entire improvement won this year.
The half-year split makes the shape more specific and rather more cautious than the annual numbers alone suggest. First-half guidance is revenue of ¥6,000 million, up 20.3%, with operating profit of ¥300 million, down 1.8%, ordinary profit of ¥300 million, down 3.3%, and net profit of ¥200 million, up 0.5%, for EPS of ¥319.05. Subtracting that from the full year leaves an implied second half of roughly ¥5,000 million of revenue carrying just ¥100 million of operating profit — a 2.0% margin, against approximately ¥139 million earned in the second half of the year just reported. Management is guiding the front half to hold roughly flat on profit despite a fifth more revenue, and the back half to fall outright.
The company's stated reasoning is macro rather than company-specific: a gradual recovery powered by the wage-price cycle, but with overseas conditions, prices and interest rates all uncertain, and the structural problems of labour shortage and population decline determining the pace of growth. Read alongside the segment data, the guidance looks like an explicit assumption that the cost inflation which already compressed gross margin this year will keep compressing it, and that the mix will keep tilting towards the 1.8%-margin building segment. There were no material subsequent events and no change to the scope of consolidation. Separately, the group flagged board changes effective at the September 25 meeting, with two directors retiring and one new director and one new audit-committee director standing for election.
| Metric | FY6/2026 | FY6/2025 | Change |
|---|---|---|---|
| Revenue (¥ million) | 10,380 | 8,199 | +26.6% |
| Operating profit (¥ million) | 445 | 327 | +36.2% |
| Ordinary profit (¥ million) | 456 | 338 | +34.9% |
| Net profit attrib. to owners of parent (¥ million) | 295 | 231 | +27.6% |
| Comprehensive income (¥ million) | 457 | 265 | +72.3% |
| Basic EPS (¥) | 471.26 | 371.94 | +26.7% |
| Operating margin | 4.3% | 4.0% | +0.3 pt |
| ROE | 8.2% | 7.1% | +1.1 pt |
| Civil engineering revenue (¥ million) | 5,270 | 4,697 | +12.2% |
| Building construction revenue (¥ million) | 5,068 | 3,450 | +46.9% |
| Operating cash flow (¥ million) | 1,468 | 79 | +¥1,389m |
| Cash and equivalents, year-end (¥ million) | 2,362 | 1,141 | +107.0% |
| Total assets (¥ million) | 6,234 | 5,086 | +22.6% |
| Net assets (¥ million) | 3,848 | 3,429 | +12.2% |
| Equity ratio | 60.9% | 66.5% | −5.6 pt |
| Book value per share (¥) | 6,055.93 | 5,439.51 | +11.3% |
| Annual dividend per share (¥) | 130.00 | 100.00 | +30.0% |
| FY6/2027 forecast revenue (¥ million) | 11,000 | 10,380 | +6.0% |
| FY6/2027 forecast operating profit (¥ million) | 400 | 445 | −10.2% |
| FY6/2027 forecast net profit (¥ million) | 260 | 295 | −11.9% |
JapanStockPulse provides informational content only and does not constitute investment advice. Figures are taken from the company's published earnings short report and may be subject to subsequent revision.